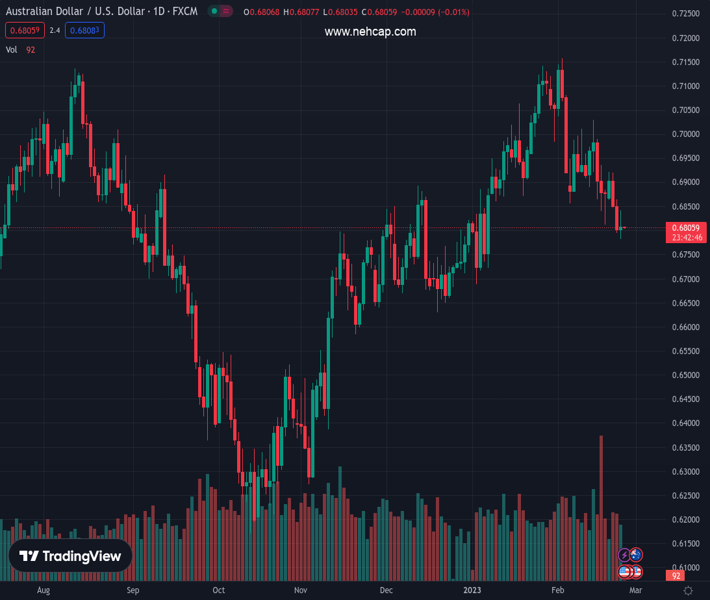
#AUDUSD @ 0.68061 retreats towards multi-day bottom, eyes the biggest loss in three weeks. (Pivot Orderbook analysis)
…
This is a premium post.
[s2If !current_user_can(access_s2member_level4)]Please register for PREMIUM VERSION HERE to read full post below containing analysis. In case of any error or you think you are not able to read the full post below, please email us at support#nehcap.com [lwa][/s2If] [s2If current_user_can(access_s2member_level4)]
- AUD/USD retreats towards multi-day bottom, eyes the biggest loss in three weeks.
- Strong US data bolstered hawkish Fed bets and weighed on the risk barometer pair.
- Hopes of US-China trade negotiations underpinned corrective bounce ahead of latest geopolitical fears-inflicted fall.
- US Core PCE Price Index for January is the key data to watch for fresh impulse.
The pair currently trades last at 0.68061.
The previous day high was 0.6865 while the previous day low was 0.6795. The daily 38.2% Fib levels comes at 0.6822, expected to provide resistance. Similarly, the daily 61.8% fib level is at 0.6838, expected to provide resistance.
AUD/USD fails to defend the late Thursday’s corrective bounce off a seven-week low, dropping back to 0.6807 during early Friday in Asia, as markets await the Federal Reserve’s (Fed) preferred inflation gauge. In addition to the pre-data anxiety, hawkish Fed concerns and geopolitical fears surrounding China and Russia also weigh on the risk barometer pair.
As per Thursday’s US data dump, the second reading of the Gross Domestic Product Annualized, better known as Real GDP, eased to 2.7% for the fourth quarter (Q4) versus 2.9% first forecasts. However, the Personal Consumption Expenditure (PCE) Price and Core PCE for the said period rose to 3.7% and 4.3% QoQ versus 3.2% and 3.9% respective first estimations.
Additionally, the Chicago Fed National Activity Index improved to 0.23 in January from -0.46 (revised), versus 0.03 analysts’ estimates. On the same line, Initial Jobless Claims also eased to 192K for the week ended on February 17 from 195K (revised) prior, compared to 200K expected. Hence, the latest set of the US data has been in accordance with the upbeat economics released so far in February and has helped the US Dollar to remain firmer, after early Thursday’s retreat.
On the other hand, comments from US Treasury Secretary Janet Yellen signaled that the US will resume discussions with China on economic issues ‘at an appropriate time’ whereas China’s Commerce Ministry urged the US to create good conditions for trade with China. The news managed to trigger the pair’s bounce off a multi-day low on Thursday. On the same line were statements from China’s commerce ministry spokesperson who said, the recovery momentum in the country’s consumer market was strong in January while also adding, “The government will take more measures to revive and expand consumption.”
However, the latest headlines suggesting China’s readiness to supply combat drones to Russia and the US Senators’ push to halt Chinese carriers overflying Russia on US flights seem to renew the market fears and weigh on the AUD/USD prices.
Amid these plays, Wall Street closed mildly positive and the US Treasury bond yields retreat from the three-month high but the US Dollar Index (DXY) remains firm ahead of the key data.
Moving on, qualitative headlines may entertain the AUD/USD traders ahead of the key US data. That said, the Personal Consumption Expenditures (PCE) Price Index is expected to have risen by 4.9% YoY in January, versus 5% prior. Further, the more relevant Core PCE Price Index, known as Fed’s favorite inflation gauge, is likely eased to 4.3% YoY, compared 4.4% prior.
Also read: US PCE Inflation Preview: Can the US Dollar turn bullish for good?
The 200-DMA support, at the 0.6800 threshold by the press time, restricts immediate AUD/USD downside.
Technical Levels: Supports and Resistances
AUDUSD currently trading at 0.6808 at the time of writing. Pair opened at 0.6805 and is trading with a change of 0.04% % .
| Overview | Overview.1 | |
|---|---|---|
| 0 | Today last price | 0.6808 |
| 1 | Today Daily Change | 0.0003 |
| 2 | Today Daily Change % | 0.04% |
| 3 | Today daily open | 0.6805 |
The pair is trading below its 20 Daily moving average @ 0.6965, below its 50 Daily moving average @ 0.689 , above its 100 Daily moving average @ 0.6718 and above its 200 Daily moving average @ 0.6804
| Trends | Trends.1 | |
|---|---|---|
| 0 | Daily SMA20 | 0.6965 |
| 1 | Daily SMA50 | 0.6890 |
| 2 | Daily SMA100 | 0.6718 |
| 3 | Daily SMA200 | 0.6804 |
The previous day high was 0.6865 while the previous day low was 0.6795. The daily 38.2% Fib levels comes at 0.6822, expected to provide resistance. Similarly, the daily 61.8% fib level is at 0.6838, expected to provide resistance.
Note the levels of interest below:
- Pivot support is noted at 0.6778, 0.6752, 0.6708
- Pivot resistance is noted at 0.6848, 0.6891, 0.6918
| Levels | Levels.1 |
|---|---|
| Previous Daily High | 0.6865 |
| Previous Daily Low | 0.6795 |
| Previous Weekly High | 0.7030 |
| Previous Weekly Low | 0.6812 |
| Previous Monthly High | 0.7143 |
| Previous Monthly Low | 0.6688 |
| Daily Fibonacci 38.2% | 0.6822 |
| Daily Fibonacci 61.8% | 0.6838 |
| Daily Pivot Point S1 | 0.6778 |
| Daily Pivot Point S2 | 0.6752 |
| Daily Pivot Point S3 | 0.6708 |
| Daily Pivot Point R1 | 0.6848 |
| Daily Pivot Point R2 | 0.6891 |
| Daily Pivot Point R3 | 0.6918 |
[/s2If]
Join Our Telegram Group
")


