#GBPUSD @ 1.20179 is dropping 0.20% on Thursdays as bears eye 1.2000. (Pivot Orderbook analysis)
…
This is a premium post.
[s2If !current_user_can(access_s2member_level4)]Please register for PREMIUM VERSION HERE to read full post below containing analysis. In case of any error or you think you are not able to read the full post below, please email us at support#nehcap.com [lwa][/s2If] [s2If current_user_can(access_s2member_level4)]
- GBP/USD is dropping 0.20% on Thursdays as bears eye 1.2000.
- On its way down, the GBP/USD fell below the 100-day EMA, which exacerbated a test of 1.1991.
The pair currently trades last at 1.20179.
The previous day high was 1.2135 while the previous day low was 1.2035. The daily 38.2% Fib levels comes at 1.2073, expected to provide resistance. Similarly, the daily 61.8% fib level is at 1.2097, expected to provide resistance.
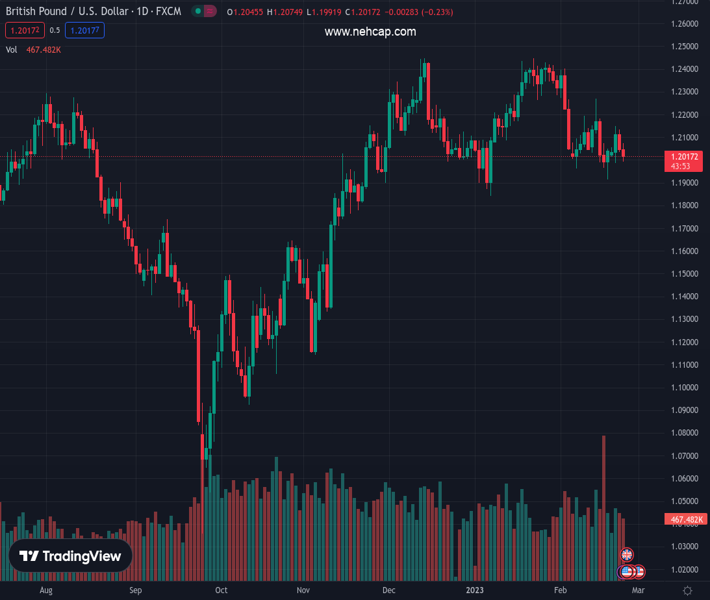
The GBP/USD tumbles below the 100-day Exponential Moving Average (EMA) as Wall Street prepares for Thursday’s close, with decent gains on a risk-on impulse. In the FX space, the US Dollar (USD) exerts pressure on most G8 currency pairs, particularly the Pound Sterling (GBP). At the time of writing, the GBP/USD is trading at 1.2018, below its opening price.
After hitting a daily high of 1.2074, the GBP/USD retreated and broke below 1.2036, the 100-day EMA, on its way to the day’s lows at 1.1991. However, the GBP/USD recovered some ground and reclaimed the 1.2000 figure as the US Dollar softened.
From a daily chart perspective, the GBP/USD is neutral to downward biased, with all the long-term EMAs resting above the spot price. In addition, the Relative Strength Index (RSI) at bearish territory aims south, indicating that sellers are gathering momentum. Therefore, GBP/USD downside is expected.
If the GBP/USD falls below the 1.2000 figure, the next support would be the weekly low of 1.1985. A breach of the latter will expose a support trendline that passes around the February 14 low of 1.1914. That will set the stage for GBP/USD sellers to regain 1.1900.
As an alternate scenario, once the GBP/USD reclaims the 100-day EMA at 1.2036, that would open the door toward 1.2100, where the 20 and 100-day EMAs lie. A rally beyond that supply area and the 200-day EMA will be up for grabs at 1.2129.
Technical Levels: Supports and Resistances
GBPUSD currently trading at 1.2023 at the time of writing. Pair opened at 1.2043 and is trading with a change of -0.17 % .
| Overview | Overview.1 | |
|---|---|---|
| 0 | Today last price | 1.2023 |
| 1 | Today Daily Change | -0.0020 |
| 2 | Today Daily Change % | -0.1700 |
| 3 | Today daily open | 1.2043 |
The pair is trading below its 20 Daily moving average @ 1.2151, below its 50 Daily moving average @ 1.2156 , above its 100 Daily moving average @ 1.1923 and above its 200 Daily moving average @ 1.1935
| Trends | Trends.1 | |
|---|---|---|
| 0 | Daily SMA20 | 1.2151 |
| 1 | Daily SMA50 | 1.2156 |
| 2 | Daily SMA100 | 1.1923 |
| 3 | Daily SMA200 | 1.1935 |
The previous day high was 1.2135 while the previous day low was 1.2035. The daily 38.2% Fib levels comes at 1.2073, expected to provide resistance. Similarly, the daily 61.8% fib level is at 1.2097, expected to provide resistance.
Note the levels of interest below:
- Pivot support is noted at 1.2007, 1.197, 1.1906
- Pivot resistance is noted at 1.2108, 1.2172, 1.2209
| Levels | Levels.1 |
|---|---|
| Previous Daily High | 1.2135 |
| Previous Daily Low | 1.2035 |
| Previous Weekly High | 1.2270 |
| Previous Weekly Low | 1.1915 |
| Previous Monthly High | 1.2448 |
| Previous Monthly Low | 1.1841 |
| Daily Fibonacci 38.2% | 1.2073 |
| Daily Fibonacci 61.8% | 1.2097 |
| Daily Pivot Point S1 | 1.2007 |
| Daily Pivot Point S2 | 1.1970 |
| Daily Pivot Point S3 | 1.1906 |
| Daily Pivot Point R1 | 1.2108 |
| Daily Pivot Point R2 | 1.2172 |
| Daily Pivot Point R3 | 1.2209 |
[/s2If]
Join Our Telegram Group
")


