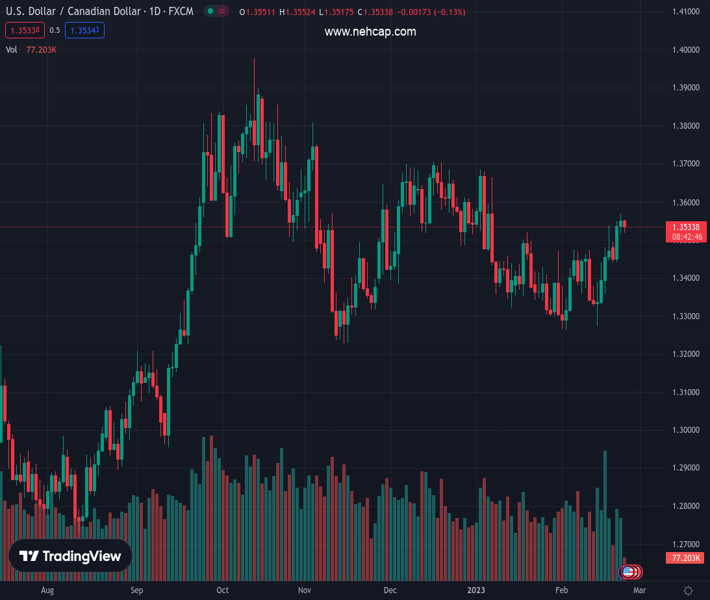
#USDCAD @ 1.35315 retreats from its highest level since January and is pressured by a combination of factors. (Pivot Orderbook analysis)
…
This is a premium post.
[s2If !current_user_can(access_s2member_level4)]Please register for PREMIUM VERSION HERE to read full post below containing analysis. In case of any error or you think you are not able to read the full post below, please email us at support#nehcap.com [lwa][/s2If] [s2If current_user_can(access_s2member_level4)]
- USD/CAD retreats from its highest level since January and is pressured by a combination of factors.
- A goodish rebound in Crude Oil prices underpins the Loonie and weighs on the pair amid a softer USD.
- The technical setup favours bullish traders and supports prospects for the emergence of dip-buying.
The pair currently trades last at 1.35315.
The previous day high was 1.3568 while the previous day low was 1.3515. The daily 38.2% Fib levels comes at 1.3548, expected to provide resistance. Similarly, the daily 61.8% fib level is at 1.3535, expected to provide resistance.
The USD/CAD pair comes under some selling pressure on Thursday and maintains its offered tone heading into the North American session. The pair is currently placed around the 1.3530 region, down less than 0.20% for the day, and so far, has managed to hold its neck above the 100-day Simple Moving Average (SMA).
A goodish recovery in Crude Oil prices underpins the commodity-linked Loonie, which, in turn, is seen as a key factor weighing on the USD/CAD pair. Apart from this, a slight improvement in the global risk sentiment acts as a headwind for the safe-haven US Dollar and exerts additional downward pressure on the major.
That said, elevated US Treasury bond yields, bolstered by the prospects for further policy tightening by the Federal Reserve, should limit any meaningful downside for the Greenback. Furthermore, looming recession risk should cap Oil prices and contribute to limiting the downside for the USD/CAD pair, at least for now.
From a technical perspective, last week’s sustained breakout through a downward sloping trend-channel was seen as a fresh trigger for bullish traders. A subsequent move and acceptance above the 100-day SMA adds credence to the constructive setup and supports prospects for a further appreciating move for the USD/CAD pair.
Hence, a further decline below the 1.3500 psychological mark could be seen as a buying opportunity and remain limited near the 50-day SMA, currently around the 1.3460 region. This is followed by the 1.3440 horizontal support, which if broken decisively could drag the USD/CAD pair back towards challenging the 1.3400 mark.
Some follow-through selling will negate any near-term positive outlook and prompt aggressive technical selling. The USD/CAD pair might then accelerate the fall further towards testing the next relevant support near the 1.3330-1.3325 region en route to the 1.3300 mark and last week’s swing low, around the 1.3275-1.3270 zone.
On the flip side, the overnight swing high, around the 1.3565-1.3570 area, now seems to act immediate hurdle ahead of the 1.3600 round figure. A sustained strength beyond the latter should allow the USD/CAD bulls to aim back towards retesting the YTD peak, around the 1.3680-1.3685 region touched in January.
Technical Levels: Supports and Resistances
USDCAD currently trading at 1.353 at the time of writing. Pair opened at 1.3556 and is trading with a change of -0.19 % .
| Overview | Overview.1 | |
|---|---|---|
| 0 | Today last price | 1.3530 |
| 1 | Today Daily Change | -0.0026 |
| 2 | Today Daily Change % | -0.1900 |
| 3 | Today daily open | 1.3556 |
The pair remains strongly bullish on the daily timeframe. It trades above its 20 SMA @ 1.3399, 50 SMA 1.3466, 100 SMA @ 1.3515 and 200 SMA @ 1.3256.
| Trends | Trends.1 | |
|---|---|---|
| 0 | Daily SMA20 | 1.3399 |
| 1 | Daily SMA50 | 1.3466 |
| 2 | Daily SMA100 | 1.3515 |
| 3 | Daily SMA200 | 1.3256 |
The previous day high was 1.3568 while the previous day low was 1.3515. The daily 38.2% Fib levels comes at 1.3548, expected to provide resistance. Similarly, the daily 61.8% fib level is at 1.3535, expected to provide resistance.
Note the levels of interest below:
- Pivot support is noted at 1.3524, 1.3493, 1.3471
- Pivot resistance is noted at 1.3578, 1.36, 1.3632
| Levels | Levels.1 |
|---|---|
| Previous Daily High | 1.3568 |
| Previous Daily Low | 1.3515 |
| Previous Weekly High | 1.3538 |
| Previous Weekly Low | 1.3274 |
| Previous Monthly High | 1.3685 |
| Previous Monthly Low | 1.3300 |
| Daily Fibonacci 38.2% | 1.3548 |
| Daily Fibonacci 61.8% | 1.3535 |
| Daily Pivot Point S1 | 1.3524 |
| Daily Pivot Point S2 | 1.3493 |
| Daily Pivot Point S3 | 1.3471 |
| Daily Pivot Point R1 | 1.3578 |
| Daily Pivot Point R2 | 1.3600 |
| Daily Pivot Point R3 | 1.3632 |
[/s2If]
Join Our Telegram Group
")


