#NZDUSD @ 0.62256 is demonstrating a volatility contraction ahead of Federal Open Market Committee minutes. (Pivot Orderbook analysis)
…
This is a premium post.
[s2If !current_user_can(access_s2member_level4)]Please register for PREMIUM VERSION HERE to read full post below containing analysis. In case of any error or you think you are not able to read the full post below, please email us at support#nehcap.com [lwa][/s2If] [s2If current_user_can(access_s2member_level4)]
- NZD/USD is demonstrating a volatility contraction ahead of Federal Open Market Committee minutes.
- A recovery in the odds of policy tightening continuation by the Federal Reserve sent US Treasury yields on fire.
- Reserve Bank of New Zealand has hiked its Official Cash Rate by 50 bps to 4.75%.
- NZD/USD might display a sheer downside after surrendering the horizontal support plotted from 0.6190.
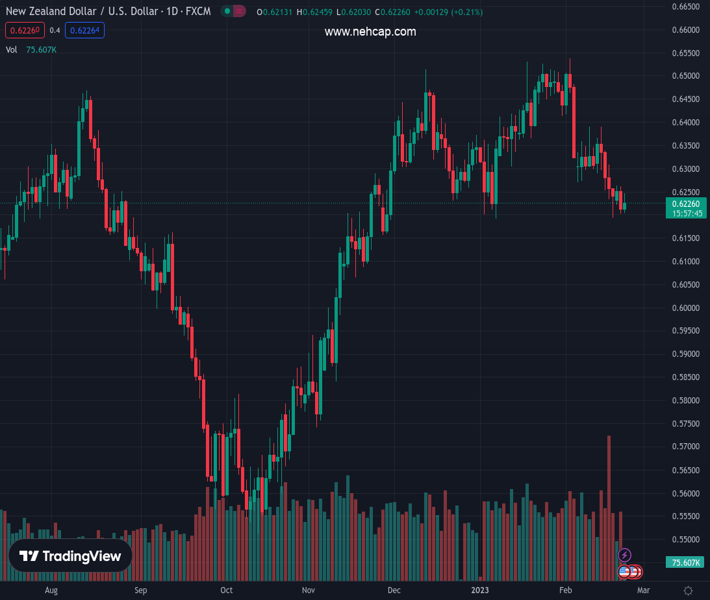
The pair currently trades last at 0.62256.
The previous day high was 0.6262 while the previous day low was 0.6203. The daily 38.2% Fib levels comes at 0.6225, expected to provide support. Similarly, the daily 61.8% fib level is at 0.6239, expected to provide resistance.
NZD/USD has turned sideways around 0.6230 in the early European session after wild movements showed post-hawkish monetary policy by the Reserve Bank of New Zealand (RBNZ). Volatility in the Kiwi asset has squeezed dramatically as investors have shifted their focus towards the release of the Federal Open Market Committee (FOMC) minutes, which are scheduled in the late New York session.
Investors’ risk-taking ability is improving gradually as the risk-sensitive assets have shown some recovery after observing sheer weakness on Tuesday. S&P500 futures have added some gains after recording the worst day of 2023. The US Dollar Index (DXY) is gradually marching towards 103.90. Weak momentum in the USD index could spoil the upside bias ahead. However, investors are expected to remain anxious ahead of the release of the FOMC minutes.
The tight labor market and solid monthly Retail Sales released this month already triggered fears of a rebound in the declining Consumer Price Index (CPI) in the United States. And, now upbeat preliminary S&P PMI (Feb) data have bolstered the case of a sheer revival in consumer spending. On Tuesday, the preliminary S&P Manufacturing PMI (Feb) climbed to 47.8 from the consensus of 47.3 and the former release of 46.9. The Services PMI soared to 50.5 from the estimates of 47.2 and the prior release of 46.8.
Economic activities in the United States were contracting in the past three months and investors started anticipating that the Federal Reserve (Fed) would consider a pause in the policy tightening spell this month. However, Fed chair Jerome Powell was reiterating that inflation is persistent and it would be premature to consider a pause or rate cut in the current monetary policy. Now, a sheer expansion in the scale of economic activities is conveying that the current monetary policy is not restrictive enough to tame stubborn inflation.
A recovery in the odds of policy tightening continuation by the Federal Reserve sent US Treasury yields on fire. The return generated on 10-year US Treasury bonds printed a fresh three-month high at 3.96%.
Investors are keenly awaiting the release of the Federal Open Market Committee (FOMC) minutes, which will provide a detailed explanation behind the 25 basis points (bps) interest rate hike by the Federal Reserve in its February monetary policy meeting. Apart from that, the minutes will determine what authorities are planning for the terminal rate and targets decided for inflation for the current year and a roadmap for achieving the 2% inflation target.
Recently, Cleveland Fed President Loretta Mester and St. Louis Fed President James Bullard have advocated for another 50 basis-point hike, which should be on the table for upcoming decisions, as reported by Bloomberg. A strong consideration for 50 bps rates might propel recession fears in the United States.
Inflationary pressures in the New Zealand economy have not peaked yet as the domestic demand is extremely solid. And Cyclone Gabrielle, considered as the worst storm, has created havoc that the price index could propel further. To strengthen the monetary tools in the battle against inflation, the Reserve Bank of New Zealand has hiked its Official Cash Rate (OCR) by 50 bps to 4.75%. In November monetary policy, Reserve Bank of New Zealand Governor Adrian Orr pushed interest rates by 75 bps.
A bumper rate hike was already expected by the RBNZ amid the fresh release of the helicopter money as New Zealand Prime Minister (PM) Chris Hipkins has promised a cyclone relief package of NZ$300 million ($187.08 million). Meanwhile, the labor market has started demonstrating devastating effects due to the continuation of policy tightening by the Reserve Bank of New Zealand.
In the monetary policy statement, Reserve Bank of New Zealand Governor Adrian Orr was loud and clear that the economy will see a recession in the period of nine to twelve months. He further added, “The central bank is encouraging savings by increasing deposit rates to avert inflation”. The central bank sees no evidence that inflation targets should be raised.
NZD/USD has been declining for the past few weeks after forming a Double Top chart pattern on a four-hour scale, which conveys a bearish reversal. The Kiwi asset has dropped to near the horizontal support plotted from January 6 low at 0.6190. A slippage below the above-mentioned horizontal support will trigger the downside momentum.
The 20-period Exponential Moving Average (EMA) at 0.6242 is acting as a major barricade for the New Zealand Dollar.
Meanwhile, the Relative Strength Index (RSI) (14) is on the verge of slipping into the bearish range of 20.00-40.00. An occurrence of the same will trigger a downside momentum.
Technical Levels: Supports and Resistances
NZDUSD currently trading at 0.6218 at the time of writing. Pair opened at 0.6209 and is trading with a change of 0.14 % .
| Overview | Overview.1 | |
|---|---|---|
| 0 | Today last price | 0.6218 |
| 1 | Today Daily Change | 0.0009 |
| 2 | Today Daily Change % | 0.1400 |
| 3 | Today daily open | 0.6209 |
The pair is trading below its 20 Daily moving average @ 0.6361, below its 50 Daily moving average @ 0.6359 , above its 100 Daily moving average @ 0.617 and above its 200 Daily moving average @ 0.6186
| Trends | Trends.1 | |
|---|---|---|
| 0 | Daily SMA20 | 0.6361 |
| 1 | Daily SMA50 | 0.6359 |
| 2 | Daily SMA100 | 0.6170 |
| 3 | Daily SMA200 | 0.6186 |
The previous day high was 0.6262 while the previous day low was 0.6203. The daily 38.2% Fib levels comes at 0.6225, expected to provide support. Similarly, the daily 61.8% fib level is at 0.6239, expected to provide resistance.
Note the levels of interest below:
- Pivot support is noted at 0.6187, 0.6165, 0.6128
- Pivot resistance is noted at 0.6247, 0.6284, 0.6306
| Levels | Levels.1 |
|---|---|
| Previous Daily High | 0.6262 |
| Previous Daily Low | 0.6203 |
| Previous Weekly High | 0.6391 |
| Previous Weekly Low | 0.6193 |
| Previous Monthly High | 0.6531 |
| Previous Monthly Low | 0.6190 |
| Daily Fibonacci 38.2% | 0.6225 |
| Daily Fibonacci 61.8% | 0.6239 |
| Daily Pivot Point S1 | 0.6187 |
| Daily Pivot Point S2 | 0.6165 |
| Daily Pivot Point S3 | 0.6128 |
| Daily Pivot Point R1 | 0.6247 |
| Daily Pivot Point R2 | 0.6284 |
| Daily Pivot Point R3 | 0.6306 |
[/s2If]
Join Our Telegram Group
")


