#EURUSD @ 1.06614 has rebounded above 1.0660 as the risk appetite of the market participants has improved. (Pivot Orderbook analysis)
…
This is a premium post.
[s2If !current_user_can(access_s2member_level4)]Please register for PREMIUM VERSION HERE to read full post below containing analysis. In case of any error or you think you are not able to read the full post below, please email us at support#nehcap.com [lwa][/s2If] [s2If current_user_can(access_s2member_level4)]
- EUR/USD has rebounded above 1.0660 as the risk appetite of the market participants has improved.
- The formation of the Symmetrical Triangle below the 61.8% Fibo retracement is indicating a volatility contraction.
- ECB Lagarde has confirmed the continuation of the 50 bps interest rate hike ahead.
The pair currently trades last at 1.06614.
The previous day high was 1.0698 while the previous day low was 1.0638. The daily 38.2% Fib levels comes at 1.0661, expected to provide support. Similarly, the daily 61.8% fib level is at 1.0675, expected to provide resistance.
The EUR/USD pair has sensed a buying interest after dropping to near 1.0640 in the Asian session. The major currency pair has rebounded as the risk appetite of the market participants has improved. The US Dollar Index (DXY) is struggling to recover after a corrective move amid a rebound in the risk-on mood, however, it would be early considering the positive risk impulse extremely solid as investors are awaiting the release of the Federal Open Market Committee (FOMC) minutes.
S&P500 futures have some decent gains in the Asian session after an intense sell-off on Tuesday. Long weekend-inspired volatility and upbeat preliminary United States S&P PMI figures were sufficient to force investors to dump US stocks.
On the Eurozone front, European Central Bank (ECB) President Christine Lagarde clearly announced “Headline inflation has begun to slowdown but reiterated that they intend to raise the key rates by 50 basis points (bps) at the upcoming policy meeting. She also cited that the central bank is not seeing a wage-price spiral in the Eurozone.
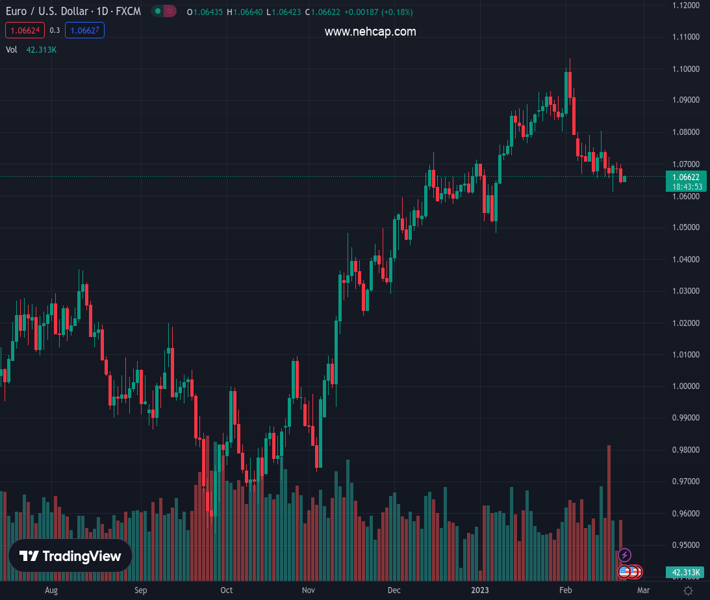
EUR/USD is continuously facing barricades around the 61.8% Fibonacci retracement (placed from January 6 low at 1.0483 to February high at 1.1033) at 1.0693. The formation of the Symmetrical Triangle chart pattern is indicating a volatility contraction in the asset.
The 100-period Exponential Moving Average (EMA) at around 1.0700 will continue to act as a major barricade for the Euro bulls.
Meanwhile, the Relative Strength Index (RSI) (14) is on the verge of slipping into the bearish range of 20.00-40.00. An occurrence of the same will trigger a downside momentum.
A decisive downside move below February 17 low at 1.0613 will drag the asset toward December 22 low at 1.0573. A slippage below the latter will extend the downside toward January 6 low at 1.0483.
In an alternate scenario, a break above February 16 high at 1.0722 will drive the asset toward 50% Fibo retracement at 1.0758, followed by February 14 high around 1.0800.
Technical Levels: Supports and Resistances
EURUSD currently trading at 1.0656 at the time of writing. Pair opened at 1.0646 and is trading with a change of 0.09 % .
| Overview | Overview.1 | |
|---|---|---|
| 0 | Today last price | 1.0656 |
| 1 | Today Daily Change | 0.0010 |
| 2 | Today Daily Change % | 0.0900 |
| 3 | Today daily open | 1.0646 |
The pair is trading below its 20 Daily moving average @ 1.0776, below its 50 Daily moving average @ 1.0729 , above its 100 Daily moving average @ 1.0427 and above its 200 Daily moving average @ 1.0331
| Trends | Trends.1 | |
|---|---|---|
| 0 | Daily SMA20 | 1.0776 |
| 1 | Daily SMA50 | 1.0729 |
| 2 | Daily SMA100 | 1.0427 |
| 3 | Daily SMA200 | 1.0331 |
The previous day high was 1.0698 while the previous day low was 1.0638. The daily 38.2% Fib levels comes at 1.0661, expected to provide support. Similarly, the daily 61.8% fib level is at 1.0675, expected to provide resistance.
Note the levels of interest below:
- Pivot support is noted at 1.0623, 1.06, 1.0562
- Pivot resistance is noted at 1.0683, 1.0721, 1.0744
| Levels | Levels.1 |
|---|---|
| Previous Daily High | 1.0698 |
| Previous Daily Low | 1.0638 |
| Previous Weekly High | 1.0805 |
| Previous Weekly Low | 1.0613 |
| Previous Monthly High | 1.0930 |
| Previous Monthly Low | 1.0483 |
| Daily Fibonacci 38.2% | 1.0661 |
| Daily Fibonacci 61.8% | 1.0675 |
| Daily Pivot Point S1 | 1.0623 |
| Daily Pivot Point S2 | 1.0600 |
| Daily Pivot Point S3 | 1.0562 |
| Daily Pivot Point R1 | 1.0683 |
| Daily Pivot Point R2 | 1.0721 |
| Daily Pivot Point R3 | 1.0744 |
[/s2If]
Join Our Telegram Group
")


