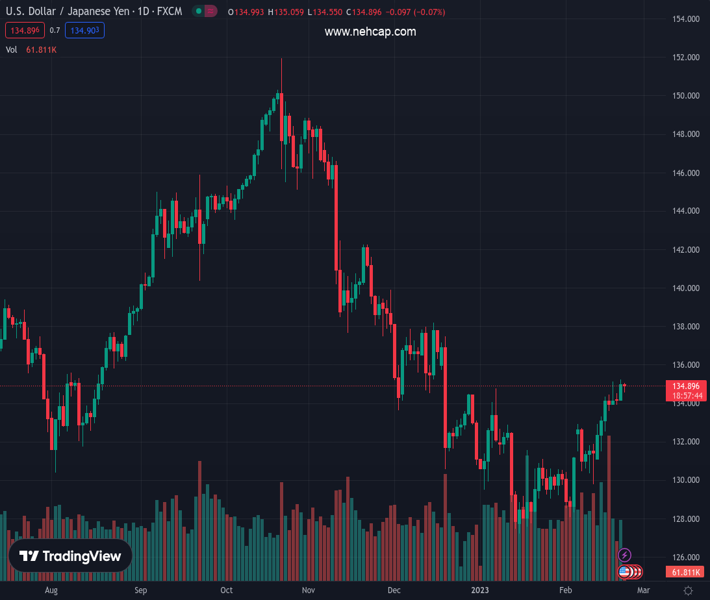
#USDJPY @ 134.896 snaps three-day uptrend as it reveres from two-month-old resistance line., @nehcap view: Limited downside expected (Pivot Orderbook analysis)
…
This is a premium post.
[s2If !current_user_can(access_s2member_level4)]Please register for PREMIUM VERSION HERE to read full post below containing analysis. In case of any error or you think you are not able to read the full post below, please email us at support#nehcap.com [lwa][/s2If] [s2If current_user_can(access_s2member_level4)]
- USD/JPY snaps three-day uptrend as it reveres from two-month-old resistance line.
- Overbought RSI (14) conditions also favor the pullback move.
- Convergence of previous resistance line from January, three-week-old ascending trend line restricts immediate downside.
The pair currently trades last at 134.896.
The previous day high was 135.23 while the previous day low was 134.15. The daily 38.2% Fib levels comes at 134.82, expected to provide support. Similarly, the daily 61.8% fib level is at 134.56, expected to provide support.
USD/JPY bulls take a breather as the quote drops to 134.70 while printing the mild losses, the first in four days, during early Wednesday. In doing so, the Yen pair portrays a U-turn from the upward-sloping resistance line from late December 2022.
Given the overbought RSI (14) also assenting to the USD/JPY pullback, the intraday sellers are likely to have a bit longer good time.
However, a convergence of the monthly resistance-turned-support line and an upward-sloping trend line from February 03, close to 134.00 at the latest, appears a tough nut to crack for the USD/JPY bears.
In a case where the Yen pair sellers manage to conquer the 134.00 key support, the odds of witnessing a slump toward the 200-SMA level surrounding 131.00 can’t be ruled out. It should be observed that six-week-long horizontal support near 132.90 can act as a buffer during the anticipated fall towards 131.00.
On the contrary, buyers need a successful break of the aforementioned multi-day-old resistance line from the last December, close to 135.20 by the press time, to keep the reins.
Following that, the late 2022 peak surrounding 138.20 and the 140.00 psychological magnet may gain the market’s attention.
Trend: Limited downside expected
Technical Levels: Supports and Resistances
USDJPY currently trading at 134.72 at the time of writing. Pair opened at 134.94 and is trading with a change of -0.16% % .
| Overview | Overview.1 | |
|---|---|---|
| 0 | Today last price | 134.72 |
| 1 | Today Daily Change | -0.22 |
| 2 | Today Daily Change % | -0.16% |
| 3 | Today daily open | 134.94 |
The pair is trading above its 20 Daily moving average @ 131.7, above its 50 Daily moving average @ 131.86 , below its 100 Daily moving average @ 137.45 and below its 200 Daily moving average @ 136.98
| Trends | Trends.1 | |
|---|---|---|
| 0 | Daily SMA20 | 131.70 |
| 1 | Daily SMA50 | 131.86 |
| 2 | Daily SMA100 | 137.45 |
| 3 | Daily SMA200 | 136.98 |
The previous day high was 135.23 while the previous day low was 134.15. The daily 38.2% Fib levels comes at 134.82, expected to provide support. Similarly, the daily 61.8% fib level is at 134.56, expected to provide support.
Note the levels of interest below:
- Pivot support is noted at 134.31, 133.69, 133.23
- Pivot resistance is noted at 135.39, 135.85, 136.47
| Levels | Levels.1 |
|---|---|
| Previous Daily High | 135.23 |
| Previous Daily Low | 134.15 |
| Previous Weekly High | 135.11 |
| Previous Weekly Low | 131.27 |
| Previous Monthly High | 134.78 |
| Previous Monthly Low | 127.22 |
| Daily Fibonacci 38.2% | 134.82 |
| Daily Fibonacci 61.8% | 134.56 |
| Daily Pivot Point S1 | 134.31 |
| Daily Pivot Point S2 | 133.69 |
| Daily Pivot Point S3 | 133.23 |
| Daily Pivot Point R1 | 135.39 |
| Daily Pivot Point R2 | 135.85 |
| Daily Pivot Point R3 | 136.47 |
[/s2If]
Join Our Telegram Group
")


