#GBPUSD @ 1.21199 picks up bids to renew intraday high, grinds near the previous daily top., @nehcap view: Further upside expected (Pivot Orderbook analysis)
…
This is a premium post.
[s2If !current_user_can(access_s2member_level4)]Please register for PREMIUM VERSION HERE to read full post below containing analysis. In case of any error or you think you are not able to read the full post below, please email us at support#nehcap.com [lwa][/s2If] [s2If current_user_can(access_s2member_level4)]
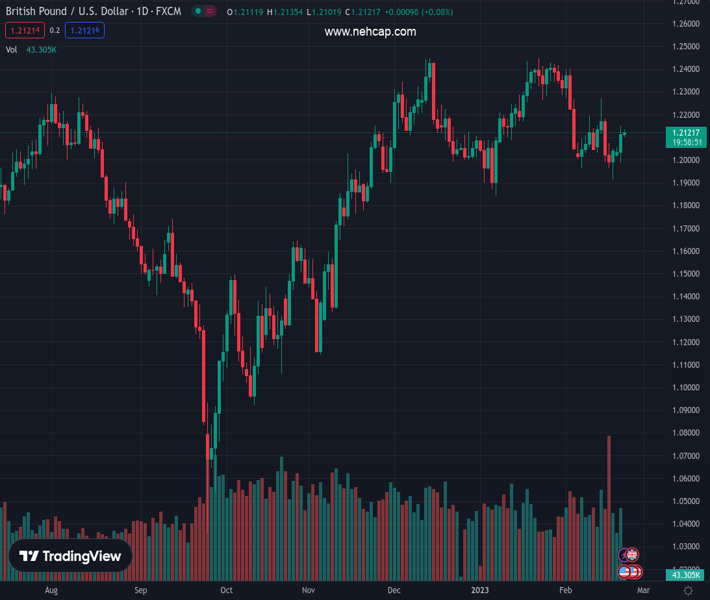
- GBP/USD picks up bids to renew intraday high, grinds near the previous daily top.
- 50-DMA caps Cable pair prices in the last three weeks.
- Looming bulls cross on MACD, sustained trading beyond 200-DMA favor buyers.
- One-month-old descending trend line adds to the upside filters.
The pair currently trades last at 1.21199.
The previous day high was 1.2148 while the previous day low was 1.1986. The daily 38.2% Fib levels comes at 1.2086, expected to provide support. Similarly, the daily 61.8% fib level is at 1.2048, expected to provide support.
GBP/USD sticks to mild gains around 1.2130, up 0.20% intraday, as bulls attack the 50-DMA resistance early Wednesday.
In doing so, the Cable pair extends its previous weekly rebound from the 200-DMA while making rounds to Tuesday’s high surrounding 1.2150.
It should be noted that the pair’s successful trading above 200-DMA joins the impending bull cross on the MACD to keep GBP/USD buyers hopeful.
That said, the 50-DMA and a downward-sloping resistance line from late January, respectively near 1.2160 and 1.2200, restrict short-term GBP/USD upside.
Following that, the last weekly top surrounding 1.2270 could probe the GBP/USD buyers before directing them to the multiple tops marked around 1.2445-50.
On the contrary, pullback moves may initially aim for the 1.2100 and 1.2050 support levels ahead of highlighting the 200-DMA level of 1.1935.
Should the GBP/USD bears dominate past 1.1935, January 2023 low near 1.1840 and the 61.8% Fibonacci retracement level of the pair’s November 2022 to February 2023 upside, near 1.1645, will be in the spotlight.
To sum up, GBP/USD remains on the front foot but the pair’s further upside needs validation from the 50-DMA and aforementioned monthly resistance line.
Trend: Further upside expected
Technical Levels: Supports and Resistances
GBPUSD currently trading at 1.2134 at the time of writing. Pair opened at 1.2106 and is trading with a change of 0.23% % .
| Overview | Overview.1 | |
|---|---|---|
| 0 | Today last price | 1.2134 |
| 1 | Today Daily Change | 0.0028 |
| 2 | Today Daily Change % | 0.23% |
| 3 | Today daily open | 1.2106 |
The pair is trading below its 20 Daily moving average @ 1.2169, below its 50 Daily moving average @ 1.2164 , above its 100 Daily moving average @ 1.1916 and above its 200 Daily moving average @ 1.1937
| Trends | Trends.1 | |
|---|---|---|
| 0 | Daily SMA20 | 1.2169 |
| 1 | Daily SMA50 | 1.2164 |
| 2 | Daily SMA100 | 1.1916 |
| 3 | Daily SMA200 | 1.1937 |
The previous day high was 1.2148 while the previous day low was 1.1986. The daily 38.2% Fib levels comes at 1.2086, expected to provide support. Similarly, the daily 61.8% fib level is at 1.2048, expected to provide support.
Note the levels of interest below:
- Pivot support is noted at 1.2012, 1.1918, 1.185
- Pivot resistance is noted at 1.2174, 1.2242, 1.2336
| Levels | Levels.1 |
|---|---|
| Previous Daily High | 1.2148 |
| Previous Daily Low | 1.1986 |
| Previous Weekly High | 1.2270 |
| Previous Weekly Low | 1.1915 |
| Previous Monthly High | 1.2448 |
| Previous Monthly Low | 1.1841 |
| Daily Fibonacci 38.2% | 1.2086 |
| Daily Fibonacci 61.8% | 1.2048 |
| Daily Pivot Point S1 | 1.2012 |
| Daily Pivot Point S2 | 1.1918 |
| Daily Pivot Point S3 | 1.1850 |
| Daily Pivot Point R1 | 1.2174 |
| Daily Pivot Point R2 | 1.2242 |
| Daily Pivot Point R3 | 1.2336 |
[/s2If]
Join Our Telegram Group
")


