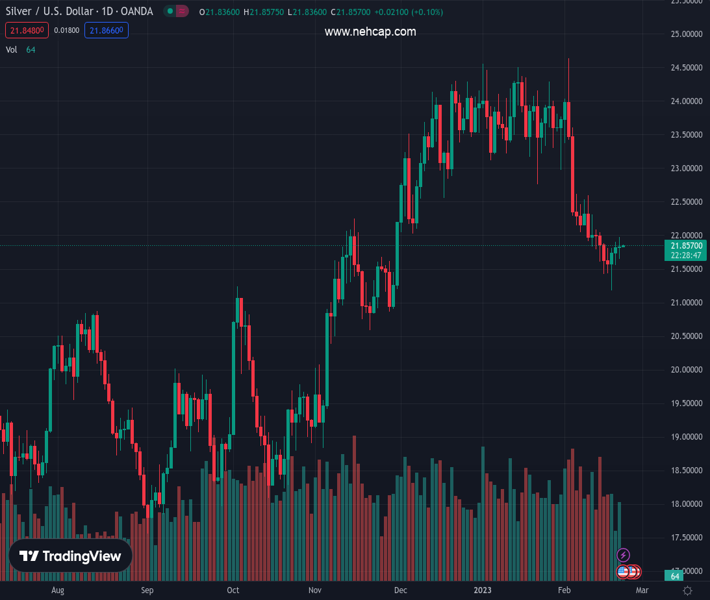
#XAGUSD @ 21.854 Silver price grinds higher after three-day winning streak. (Pivot Orderbook analysis)
…
This is a premium post.
[s2If !current_user_can(access_s2member_level4)]Please register for PREMIUM VERSION HERE to read full post below containing analysis. In case of any error or you think you are not able to read the full post below, please email us at support#nehcap.com [lwa][/s2If] [s2If current_user_can(access_s2member_level4)]
- Silver price grinds higher after three-day winning streak.
- Upbeat US data, yields underpin US Dollar rebound and probe XAG/USD bulls.
- A mentioning of Fed policymakers’ discussion on pivot could propel Silver price.
The pair currently trades last at 21.854.
The previous day high was 21.91 while the previous day low was 21.55. The daily 38.2% Fib levels comes at 21.77, expected to provide support. Similarly, the daily 61.8% fib level is at 21.69, expected to provide support.
Silver price (XAG/USD) seesaws around $21.85 as bulls take a breather during early Wednesday, after three-day uptrend. In doing so, the bright metal fails to respect the US Dollar’s latest rebound but shows traders’ anxiety ahead of the week’s key event.
That said, the XAG/USD bulls could have traced the hopes of more industrial demand amid a recent jump in the manufacturing activity data from major economies, including the UK, the US, Germany and Europe.
On the other hand, the US Dollar Index (DXY) snapped a two-day downtrend to regain 104.00 on Tuesday, grinding higher around 104.20 by the press time, as the US PMIs for February propelled hawkish Fed bets.
It should be noted that the preliminary readings of the US S&P Global Manufacturing PMI rose to 47.8 from 46.9 prior and versus 47.3 market forecasts while the Services PMI jumped to the eight-month high to 50.5 compared to 47.2 expected and 46.8 previous readings. As a result, the S&P Global Composite PMI surpassed 47.5 analysts’ consensus and 46.8 previous reading to mark 50.2 figure.
Following the data, the FEDWATCH tool signals that the money market participants see the benchmark level peaking at 5.3% in July, and staying near those levels throughout the year, versus 5.10% expected by the US Federal Reserve (Fed).
Other than the Fed bets, the upbeat US data also propelled the US Treasury bond yields as the benchmark 10-year bond coupon refreshed a three-month high near 3.95%. Further, the two-year counterpart also jumped to the highest levels since early November 2022, to 4.73% at latest, which in turn propelled the US Dollar and should have capped the XAG/USD upside.
Elsewhere, Wall Street closed in the red as geopolitical fears emanating from Russia and China joined the aforementioned hawkish Fed bets, as well as downbeat earnings forecasts from the tops US retailers including Home Depot and Wall Mart.
Moving on, Fed Minutes should be eyed for policy pivot talks considering the latest cautiously optimistic tone of the policymakers. That said, XAG/USD may rally in case of a policymarkers’ discussion on pausing the rate hikes trajectory.
Despite the latest rebound, Silver price needs to provide a daily closing beyond the 100-DMA, around $22.00 by the press time.
Technical Levels: Supports and Resistances
XAGUSD currently trading at 21.86 at the time of writing. Pair opened at 21.82 and is trading with a change of 0.18 % .
| Overview | Overview.1 | |
|---|---|---|
| 0 | Today last price | 21.86 |
| 1 | Today Daily Change | 0.04 |
| 2 | Today Daily Change % | 0.18 |
| 3 | Today daily open | 21.82 |
The pair is trading below its 20 Daily moving average @ 22.68, below its 50 Daily moving average @ 23.31 , below its 100 Daily moving average @ 21.99 and above its 200 Daily moving average @ 21.02
| Trends | Trends.1 | |
|---|---|---|
| 0 | Daily SMA20 | 22.68 |
| 1 | Daily SMA50 | 23.31 |
| 2 | Daily SMA100 | 21.99 |
| 3 | Daily SMA200 | 21.02 |
The previous day high was 21.91 while the previous day low was 21.55. The daily 38.2% Fib levels comes at 21.77, expected to provide support. Similarly, the daily 61.8% fib level is at 21.69, expected to provide support.
Note the levels of interest below:
- Pivot support is noted at 21.61, 21.4, 21.26
- Pivot resistance is noted at 21.97, 22.12, 22.33
| Levels | Levels.1 |
|---|---|
| Previous Daily High | 21.91 |
| Previous Daily Low | 21.55 |
| Previous Weekly High | 22.08 |
| Previous Weekly Low | 21.18 |
| Previous Monthly High | 24.55 |
| Previous Monthly Low | 22.76 |
| Daily Fibonacci 38.2% | 21.77 |
| Daily Fibonacci 61.8% | 21.69 |
| Daily Pivot Point S1 | 21.61 |
| Daily Pivot Point S2 | 21.40 |
| Daily Pivot Point S3 | 21.26 |
| Daily Pivot Point R1 | 21.97 |
| Daily Pivot Point R2 | 22.12 |
| Daily Pivot Point R3 | 22.33 |
[/s2If]
Join Our Telegram Group
")


