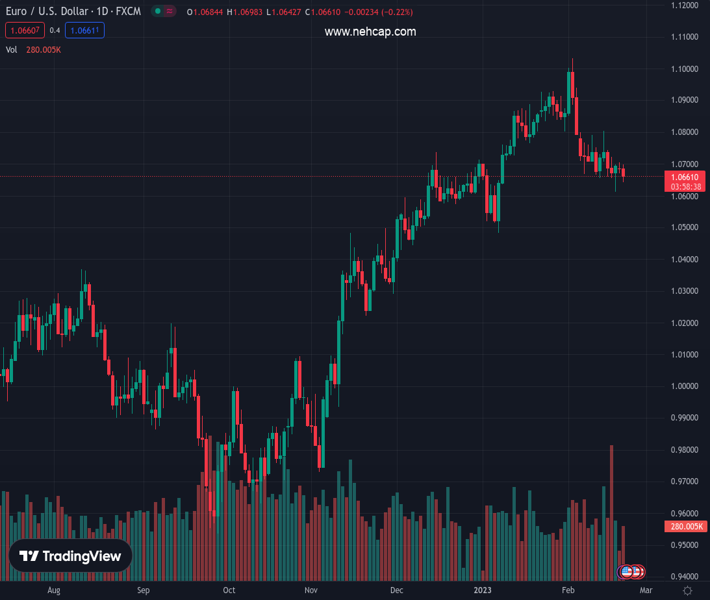
#EURUSD @ 1.06605 drops steadily as traders wait for FOMC’s minutes. (Pivot Orderbook analysis)
…
This is a premium post.
[s2If !current_user_can(access_s2member_level4)]Please register for PREMIUM VERSION HERE to read full post below containing analysis. In case of any error or you think you are not able to read the full post below, please email us at support#nehcap.com [lwa][/s2If] [s2If current_user_can(access_s2member_level4)]
- EUR/USD drops steadily as traders wait for FOMC’s minutes.
- US S&P Global PMI for February showed the economy’s resilience, except for manufacturing activity.
- ECB’s Rehn commented that lifting rates in March is appropriate and should continue until the summer.
The pair currently trades last at 1.06605.
The previous day high was 1.0705 while the previous day low was 1.067. The daily 38.2% Fib levels comes at 1.0683, expected to provide resistance. Similarly, the daily 61.8% fib level is at 1.0692, expected to provide resistance.
EUR/USD extends its bearish continuation after Monday’s gains, offset by the US Dollar (USD), were sponsored by a risk-off impulse, despite upbeat data revealed in the Euro area. Nevertheless, US PMIs showed after Wall Street’s opening justified US Dollar strength, hence the EUR/USD fall. At the time of writing, the EUR/USD declined 0.37%, trading at 1.0661.
S&P Global announced that the US economy experienced a boost in business activity in February, with all indices exceeding expectations. However, despite this positive development, the S&P Global Manufacturing PMI indicated that manufacturing activity remained in contractionary territory, coming at 47.8.
Meanwhile, according to wires, geopolitical developments surrounding the conflict between Russia and Ukraine have escalated. Anthony Blinken, the US Secretary of State, cautioned China against providing additional military support to Russia during its invasion of Ukraine. He also stated that there would be severe repercussions if such assistance were given. Meanwhile, in a display of US support after Blinken’s remarks, President Joe Biden visited Ukraine’s President Zelenskyy in Kyiv.
Earlier in the European session, mixed PMI data for the bloc was unveiled by S&P Global. The S&P Global Services and Composite PMIs were better than expected in Germany and the Eurozone, though the Manufacturing Indices remained in contraction. Aside from this, the German ZEW economic sentiment improved to 28.1
In central bank speaking, a slew of European Central Bank (ECB) officials added to the chorus of hawks, namely Rehn. He said it’s appropriate to raise rates beyond March, and rates need to peak around the summer of 2023 while pushing back against rate cuts.
Given the backdrop, the EUR/USD fell from around the week’s high and has retraced below the 1.0660 area. However, EUR/USD traders will face a solid support area around the 50 and 20-day Exponential Moving Average (EMAs), followed by further demand areas. Nevertheless, neither sellers/buyers have opened new positions, as they await the release of the latest FOMC meeting minutes.
The single currency’s failure to crack the 100-day EMA at 1.0842 exacerbated the EUR/USD’s pair fall toward the 1.0600 area. In addition, further Relative Strength Index (RSI) lower readings, as buyers’ pressure fades, and the Rate of Change (RoC) indicating that sellers are gathering momentum justified the leg-down. Therefore, the EUR/USD path of least resistance is downwards.
The EUR/USD next support would be the 1.0600 mark. A breach of the latter will drive prices to the 50-day EMA at 1.0584, followed by the 20-day EMA at 1.0584.
Technical Levels: Supports and Resistances
EURUSD currently trading at 1.0658 at the time of writing. Pair opened at 1.0685 and is trading with a change of -0.25 % .
| Overview | Overview.1 | |
|---|---|---|
| 0 | Today last price | 1.0658 |
| 1 | Today Daily Change | -0.0027 |
| 2 | Today Daily Change % | -0.2500 |
| 3 | Today daily open | 1.0685 |
The pair is trading below its 20 Daily moving average @ 1.0788, below its 50 Daily moving average @ 1.0728 , above its 100 Daily moving average @ 1.0421 and above its 200 Daily moving average @ 1.033
| Trends | Trends.1 | |
|---|---|---|
| 0 | Daily SMA20 | 1.0788 |
| 1 | Daily SMA50 | 1.0728 |
| 2 | Daily SMA100 | 1.0421 |
| 3 | Daily SMA200 | 1.0330 |
The previous day high was 1.0705 while the previous day low was 1.067. The daily 38.2% Fib levels comes at 1.0683, expected to provide resistance. Similarly, the daily 61.8% fib level is at 1.0692, expected to provide resistance.
Note the levels of interest below:
- Pivot support is noted at 1.0668, 1.0652, 1.0634
- Pivot resistance is noted at 1.0703, 1.0721, 1.0737
| Levels | Levels.1 |
|---|---|
| Previous Daily High | 1.0705 |
| Previous Daily Low | 1.0670 |
| Previous Weekly High | 1.0805 |
| Previous Weekly Low | 1.0613 |
| Previous Monthly High | 1.0930 |
| Previous Monthly Low | 1.0483 |
| Daily Fibonacci 38.2% | 1.0683 |
| Daily Fibonacci 61.8% | 1.0692 |
| Daily Pivot Point S1 | 1.0668 |
| Daily Pivot Point S2 | 1.0652 |
| Daily Pivot Point S3 | 1.0634 |
| Daily Pivot Point R1 | 1.0703 |
| Daily Pivot Point R2 | 1.0721 |
| Daily Pivot Point R3 | 1.0737 |
[/s2If]
Join Our Telegram Group
")


