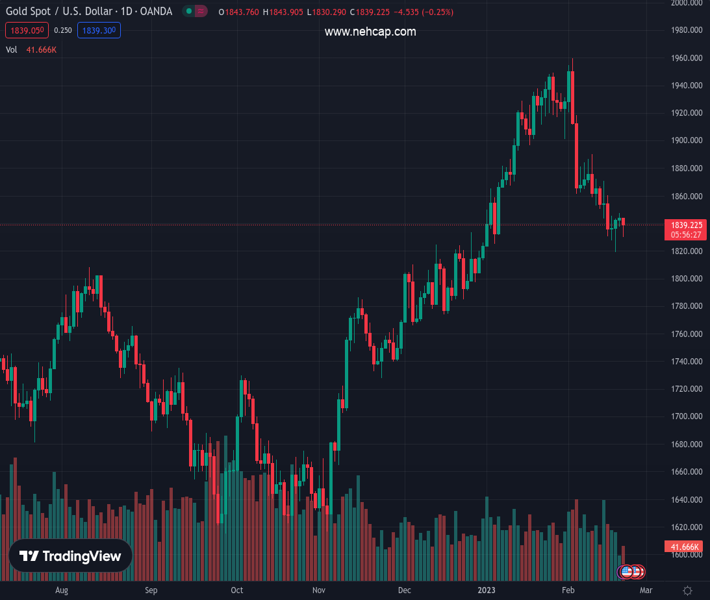
#XAUUSD @ 1,839.09 Gold price slides after failing to break Monday’s high of 1847.45, down 0.08%. (Pivot Orderbook analysis)
…
This is a premium post.
[s2If !current_user_can(access_s2member_level4)]Please register for PREMIUM VERSION HERE to read full post below containing analysis. In case of any error or you think you are not able to read the full post below, please email us at support#nehcap.com [lwa][/s2If] [s2If current_user_can(access_s2member_level4)]
- Gold price slides after failing to break Monday’s high of 1847.45, down 0.08%.
- US S&P Global PMIs for February were better than expected, except for the Manufacturing Index, which remained in contractionary territory.
- China-US tensions around military aid on Russia dented market mood.
The pair currently trades last at 1839.09.
The previous day high was 1847.59 while the previous day low was 1837.36. The daily 38.2% Fib levels comes at 1841.27, expected to provide resistance. Similarly, the daily 61.8% fib level is at 1843.68, expected to provide resistance.
Gold price slides in the North American session while the US Dollar (USD) rises sharply on risk aversion. Expectations that the US Federal Reserve (Fed) would tighten monetary conditions “aggressively” keeps investors uneasy. At the same time, Fed officials hawkish rhetoric added to those speculations, with money market futures expecting rates as high as the 5.25%-5.50% range. The XAU/USD is exchanging hands at around 1838.58.
US equities opened in the red as sentiment remains sour. S&P Global revealed that the US economy in February posted a recovery in business activity, with all the indices above estimates. However, as measured by the S&P Global Manufacturing PMI, manufacturing activity remained at 47.8 in the contractionary territory.
“Despite headwinds from higher interest rates and the cost of living squeeze, the business mood has brightened amid signs that inflation has peaked and recession risks have faded,” said Chris Williamson, a chief business economist at S&P Global Market Intelligence. He added that supply constraints had alleviated delivery times.
The US Dollar Index, a gauge of the buck’s value vs. a basket of currencies, began to trim some of its earlier gains following the release of the PMI report, after hitting a daily high of 104.260, it’s down 0.12% at 103.878. Contrarily, the US 10-year benchmark note rate sits at 3.908%, gains six bps, capping the yellow metal rally, with XAU’s bulls eyeing a test of the $1850 area.
Geopolitical-wise, the US Secretary of State Anthony Blinken warned China not to provide further lethal military help to Russia in its invasion of Ukraine, adding that “serious consequences” would happen if it did so. In the meantime, US President Joe Biden visited Ukraine’s President Zelenskyy in Kyev, showing US support after Blinken’s comments.
Aside from this, Wednesday’s US economic docket will feature the latest FOMC meeting minutes, which could shed some light regarding the forward path that the US Federal Reserve would follow in monetary policy.
XAU/USD’s daily chart suggests the yellow metal as neutral biased. It should be said that if XAU/USD does not print a new high in the week, that could pave the way for further downside. Oscillator-wise, the path of least resistance is downwards, with the Relative Strength Index (RSI) in bearish territory aiming south, while the Rate of Change (RoC) displays buying pressure is fading.
Therefore, the XAU/USD first support would be the 100-day Exponential Moving Average (EMA) at $1820.45, followed the last week’s low of $1818.97. A breach of the latter will expose the $1800 mark.
Technical Levels: Supports and Resistances
XAUUSD currently trading at 1838.79 at the time of writing. Pair opened at 1841.47 and is trading with a change of -0.15 % .
| Overview | Overview.1 | |
|---|---|---|
| 0 | Today last price | 1838.79 |
| 1 | Today Daily Change | -2.68 |
| 2 | Today Daily Change % | -0.15 |
| 3 | Today daily open | 1841.47 |
The pair is trading below its 20 Daily moving average @ 1886.51, below its 50 Daily moving average @ 1863.2 , above its 100 Daily moving average @ 1787.91 and above its 200 Daily moving average @ 1776.14
| Trends | Trends.1 | |
|---|---|---|
| 0 | Daily SMA20 | 1886.51 |
| 1 | Daily SMA50 | 1863.20 |
| 2 | Daily SMA100 | 1787.91 |
| 3 | Daily SMA200 | 1776.14 |
The previous day high was 1847.59 while the previous day low was 1837.36. The daily 38.2% Fib levels comes at 1841.27, expected to provide resistance. Similarly, the daily 61.8% fib level is at 1843.68, expected to provide resistance.
Note the levels of interest below:
- Pivot support is noted at 1836.69, 1831.91, 1826.46
- Pivot resistance is noted at 1846.92, 1852.37, 1857.15
| Levels | Levels.1 |
|---|---|
| Previous Daily High | 1847.59 |
| Previous Daily Low | 1837.36 |
| Previous Weekly High | 1870.71 |
| Previous Weekly Low | 1818.93 |
| Previous Monthly High | 1949.27 |
| Previous Monthly Low | 1823.76 |
| Daily Fibonacci 38.2% | 1841.27 |
| Daily Fibonacci 61.8% | 1843.68 |
| Daily Pivot Point S1 | 1836.69 |
| Daily Pivot Point S2 | 1831.91 |
| Daily Pivot Point S3 | 1826.46 |
| Daily Pivot Point R1 | 1846.92 |
| Daily Pivot Point R2 | 1852.37 |
| Daily Pivot Point R3 | 1857.15 |
[/s2If]
Join Our Telegram Group
")


