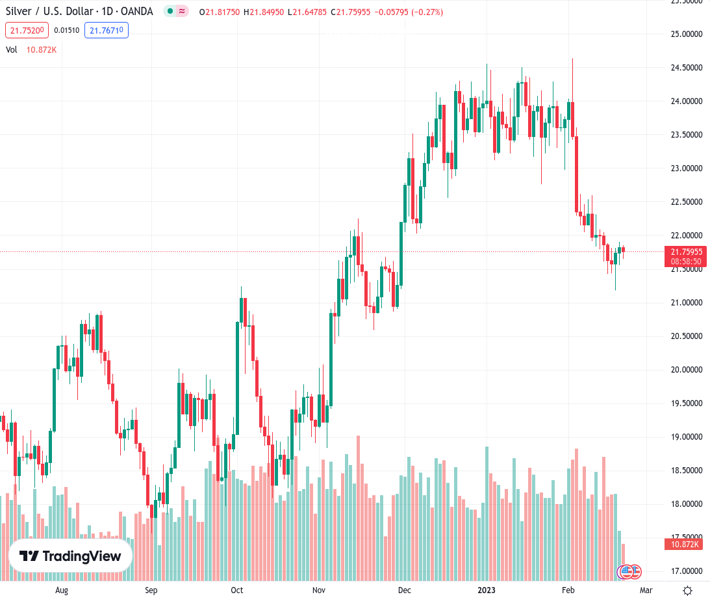
#XAGUSD @ 21.742 Silver faces rejection near the 100-day SMA and comes under some selling pressure on Tuesday. (Pivot Orderbook analysis)
…
This is a premium post.
[s2If !current_user_can(access_s2member_level4)]Please register for PREMIUM VERSION HERE to read full post below containing analysis. In case of any error or you think you are not able to read the full post below, please email us at support#nehcap.com [lwa][/s2If] [s2If current_user_can(access_s2member_level4)]
- Silver faces rejection near the 100-day SMA and comes under some selling pressure on Tuesday.
- The setup still favours bearish traders and supports prospects for a further depreciating move.
- A sustained strength beyond the $22.55-$22.60 region is needed to negate the bearish outlook.
The pair currently trades last at 21.742.
The previous day high was 21.91 while the previous day low was 21.55. The daily 38.2% Fib levels comes at 21.77, expected to provide resistance. Similarly, the daily 61.8% fib level is at 21.69, expected to provide support.
Silver edges lower on Tuesday and snaps a two-day winning streak, albeit manages to hold above the $21.50 level heading into the North American session.
From a technical perspective, the recent bounce from the YTD low, around the $21.20-$21.15 region set last Friday faltered ahead of the $22.00 mark on Monday. The said handle coincides with the 100-day Simple Moving Average (SMA) support breakpoint and should now act as a pivotal point for the XAG/USD.
Some follow-through buying beyond the $22.15 zone, representing the 38.2% Fibonacci retracement level of the recent rally from October 2022, might prompt some technical buying. The momentum could lift the XAG/USD further, though is more likely to meet with a fresh supply near the $22.55-$22.60 hurdle.
That said, a sustained strength beyond the latter will shift the bias back in favour of bullish traders and pave the way for additional gains. The XAG/USD might then accelerate the positive move to 23.6% Fibo. level, around the $23.00 mark, before climbing to the $23.35-$23.40 strong horizontal resistance.
On the flip side, the 50% Fibo. level, around the $21.35 area, seems to protect the immediate downside ahead of Friday’s swing low, around the $21.20-$21.15 zone. Failure to defend the said support levels could make the XAG/USD vulnerable to weaken below the $21.00 mark, towards the $20.60 region.
Given that technical indicators on the daily chart are holding deep in the negative territory, the downward trajectory could get extended further towards challenging the $20.00 psychological mark. The XAG/USD could eventually drop to test the next relevant support near the $19.75-$19.70 horizontal zone.
Technical Levels: Supports and Resistances
XAGUSD currently trading at 21.72 at the time of writing. Pair opened at 21.82 and is trading with a change of -0.46 % .
| Overview | Overview.1 | |
|---|---|---|
| 0 | Today last price | 21.72 |
| 1 | Today Daily Change | -0.10 |
| 2 | Today Daily Change % | -0.46 |
| 3 | Today daily open | 21.82 |
The pair is trading below its 20 Daily moving average @ 22.68, below its 50 Daily moving average @ 23.31 , below its 100 Daily moving average @ 21.99 and above its 200 Daily moving average @ 21.02
| Trends | Trends.1 | |
|---|---|---|
| 0 | Daily SMA20 | 22.68 |
| 1 | Daily SMA50 | 23.31 |
| 2 | Daily SMA100 | 21.99 |
| 3 | Daily SMA200 | 21.02 |
The previous day high was 21.91 while the previous day low was 21.55. The daily 38.2% Fib levels comes at 21.77, expected to provide resistance. Similarly, the daily 61.8% fib level is at 21.69, expected to provide support.
Note the levels of interest below:
- Pivot support is noted at 21.61, 21.4, 21.26
- Pivot resistance is noted at 21.97, 22.12, 22.33
| Levels | Levels.1 |
|---|---|
| Previous Daily High | 21.91 |
| Previous Daily Low | 21.55 |
| Previous Weekly High | 22.08 |
| Previous Weekly Low | 21.18 |
| Previous Monthly High | 24.55 |
| Previous Monthly Low | 22.76 |
| Daily Fibonacci 38.2% | 21.77 |
| Daily Fibonacci 61.8% | 21.69 |
| Daily Pivot Point S1 | 21.61 |
| Daily Pivot Point S2 | 21.40 |
| Daily Pivot Point S3 | 21.26 |
| Daily Pivot Point R1 | 21.97 |
| Daily Pivot Point R2 | 22.12 |
| Daily Pivot Point R3 | 22.33 |
[/s2If]
Join Our Telegram Group
")


