#USDJPY @ 134.394 sticks to mild gains during three-day winning streak., @nehcap view: Further upside expected (Pivot Orderbook analysis)
…
This is a premium post.
[s2If !current_user_can(access_s2member_level4)]Please register for PREMIUM VERSION HERE to read full post below containing analysis. In case of any error or you think you are not able to read the full post below, please email us at support#nehcap.com [lwa][/s2If] [s2If current_user_can(access_s2member_level4)]
- USD/JPY sticks to mild gains during three-day winning streak.
- Convergence of 200-day EMA, 13-day-old ascending trend line restricts short-term downside.
- 100-day EMA guards immediate upside near two-month high.
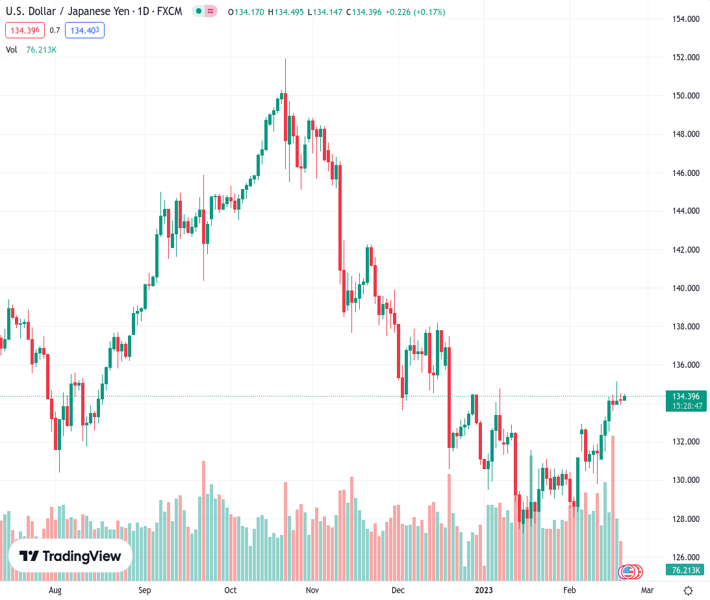
The pair currently trades last at 134.394.
The previous day high was 134.54 while the previous day low was 133.92. The daily 38.2% Fib levels comes at 134.3, expected to provide support. Similarly, the daily 61.8% fib level is at 134.16, expected to provide support.
USD/JPY seesaws around intraday high near 134.40 as bulls keep the reins for the third consecutive day amid early Tuesday morning in Europe. In doing so, the Yen pair also prints mild gains near the highest levels in two months, poked on Friday.
That said, the 200-day Exponential Moving Average (EMA) joins an upward-sloping trend line from February 02 to restrict the USD/JPY pair’s immediate downside near 133.80. However, the 100-day EMA level surrounding 134.75 guards nearby the upside.
It’s worth noting, however, that the bullish MACD signals and higher low bullish formation on the daily chart keep the USD/JPY pair buyers hopeful.
That said, the recent top surrounding 135.10, marked on Friday, acts as an extra filter towards the north past 100-day EMA.
Following that, a run-up towards mid-December 2022, close to 138.20, can’t be ruled out. Though, the 140.00 psychological magnet may challenge the Yen pair buyers afterward.
Meanwhile, a downside break of the 133.80 support confluence could quickly drag the USD/JPY price towards an early month swing high near 132.90.
Though, multiple levels near 31.30-20 and the 130.00 round figure could challenge the USD/JPY pair’s downside past 132.90.
In a case where the quote remains bearish below 132.90, the previous monthly low of 127.21 will be in the spotlight.
Trend: Further upside expected
Technical Levels: Supports and Resistances
USDJPY currently trading at 134.41 at the time of writing. Pair opened at 134.26 and is trading with a change of 0.11% % .
| Overview | Overview.1 | |
|---|---|---|
| 0 | Today last price | 134.41 |
| 1 | Today Daily Change | 0.15 |
| 2 | Today Daily Change % | 0.11% |
| 3 | Today daily open | 134.26 |
The pair is trading above its 20 Daily moving average @ 131.46, above its 50 Daily moving average @ 131.88 , below its 100 Daily moving average @ 137.54 and below its 200 Daily moving average @ 136.95
| Trends | Trends.1 | |
|---|---|---|
| 0 | Daily SMA20 | 131.46 |
| 1 | Daily SMA50 | 131.88 |
| 2 | Daily SMA100 | 137.54 |
| 3 | Daily SMA200 | 136.95 |
The previous day high was 134.54 while the previous day low was 133.92. The daily 38.2% Fib levels comes at 134.3, expected to provide support. Similarly, the daily 61.8% fib level is at 134.16, expected to provide support.
Note the levels of interest below:
- Pivot support is noted at 133.94, 133.62, 133.32
- Pivot resistance is noted at 134.56, 134.86, 135.17
| Levels | Levels.1 |
|---|---|
| Previous Daily High | 134.54 |
| Previous Daily Low | 133.92 |
| Previous Weekly High | 135.11 |
| Previous Weekly Low | 131.27 |
| Previous Monthly High | 134.78 |
| Previous Monthly Low | 127.22 |
| Daily Fibonacci 38.2% | 134.30 |
| Daily Fibonacci 61.8% | 134.16 |
| Daily Pivot Point S1 | 133.94 |
| Daily Pivot Point S2 | 133.62 |
| Daily Pivot Point S3 | 133.32 |
| Daily Pivot Point R1 | 134.56 |
| Daily Pivot Point R2 | 134.86 |
| Daily Pivot Point R3 | 135.17 |
[/s2If]
Join Our Telegram Group
")


