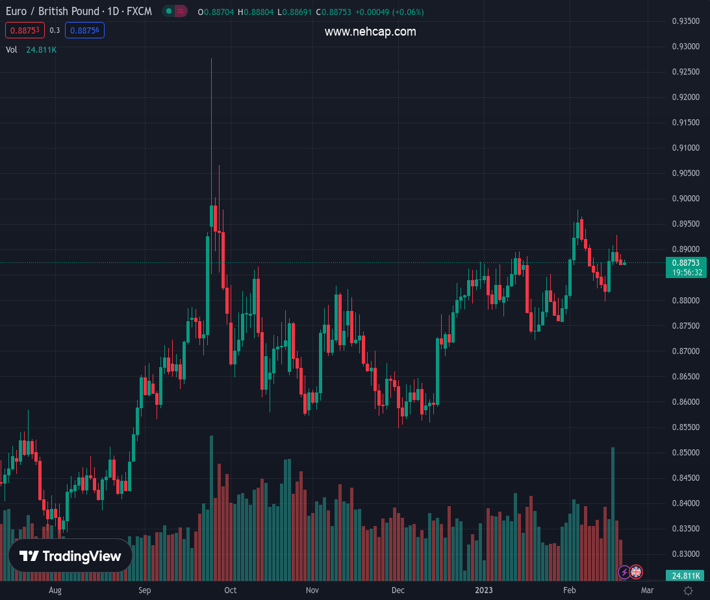
#EURGBP @ 0.88761 is auctioning in a volatility contraction pattern ahead of the UK/Eurozone PMIs release. (Pivot Orderbook analysis)
…
This is a premium post.
[s2If !current_user_can(access_s2member_level4)]Please register for PREMIUM VERSION HERE to read full post below containing analysis. In case of any error or you think you are not able to read the full post below, please email us at support#nehcap.com [lwa][/s2If] [s2If current_user_can(access_s2member_level4)]
- EUR/GBP is auctioning in a volatility contraction pattern ahead of the UK/Eurozone PMIs release.
- ECB Rehn sees more interest rate hikes beyond March and expects that Eurozone will avoid recession.
- A pause in the policy tightening spell might create troubles for the BoE as the inflation figure is still double in digits.
The pair currently trades last at 0.88761.
The previous day high was 0.8892 while the previous day low was 0.8871. The daily 38.2% Fib levels comes at 0.8879, expected to provide resistance. Similarly, the daily 61.8% fib level is at 0.8884, expected to provide resistance.
The EUR/GBP pair is displaying a sideways auction in a narrow range of 0.8870-0.8890 in the Tokyo session. The cross has turned sideways as investors are awaiting the release of the preliminary PMI figures for the Eurozone and the United Kingdom for further impetus.
Considering the fact that economic activities in the UK region are slowing down as the Bank of England (BoE) has increased interest rates dramatically, the street is expecting a pause in the policy tightening spell. This could create trouble for the BoE as the inflation figures are still double in digits.
Meanwhile, Eurozone inflation is declining meaningfully but is still far from the desired rate. European Central Bank (ECB) Governing Council member Olli Rehn cited “It would be appropriate for the European Central Bank to raise rates beyond March and reach the terminal rate this summer,” as reported by Reuters. He further added that Eurozone may avoid recession and the growth will be around 1%.
EUR/GBP is auctioning in a Symmetrical Triangle chart pattern that indicates a sheer contraction in volatility, which is followed by a breakout in the same. The downward-sloping trendline of the above-mentioned chart pattern is placed from February 3 high at 0.8979 while the upward-sloping trendline is placed from January 19 low at 0.8722.
The 20-period Exponential Moving Average (EMA) at 0.8880 is overlapping on the asset price, which indicates indecisiveness in the sentiment of the market participants.
Meanwhile, the Relative Strength Index (RSI) (14) is oscillating in the 40.00-60.00, which signals a lackluster performance ahead.
Should the cross breaks above February 17 high at 0.8929, Euro bulls will drive the asset towards February 3 high at 0.8979 followed by the psychological support at 0.9000.
On the flip side, a breakdown below February 14 low at 0.8804 will expose the asset to January 29 low at 0.8763 and January 19 low at 0.8722.
Technical Levels: Supports and Resistances
EURGBP currently trading at 0.8877 at the time of writing. Pair opened at 0.8877 and is trading with a change of 0.0 % .
| Overview | Overview.1 | |
|---|---|---|
| 0 | Today last price | 0.8877 |
| 1 | Today Daily Change | 0.0000 |
| 2 | Today Daily Change % | 0.0000 |
| 3 | Today daily open | 0.8877 |
The pair remains strongly bullish on the daily timeframe. It trades above its 20 SMA @ 0.8857, 50 SMA 0.8817, 100 SMA @ 0.8749 and 200 SMA @ 0.8654.
| Trends | Trends.1 | |
|---|---|---|
| 0 | Daily SMA20 | 0.8857 |
| 1 | Daily SMA50 | 0.8817 |
| 2 | Daily SMA100 | 0.8749 |
| 3 | Daily SMA200 | 0.8654 |
The previous day high was 0.8892 while the previous day low was 0.8871. The daily 38.2% Fib levels comes at 0.8879, expected to provide resistance. Similarly, the daily 61.8% fib level is at 0.8884, expected to provide resistance.
Note the levels of interest below:
- Pivot support is noted at 0.8868, 0.8859, 0.8847
- Pivot resistance is noted at 0.8889, 0.8901, 0.891
| Levels | Levels.1 |
|---|---|
| Previous Daily High | 0.8892 |
| Previous Daily Low | 0.8871 |
| Previous Weekly High | 0.8929 |
| Previous Weekly Low | 0.8804 |
| Previous Monthly High | 0.8897 |
| Previous Monthly Low | 0.8722 |
| Daily Fibonacci 38.2% | 0.8879 |
| Daily Fibonacci 61.8% | 0.8884 |
| Daily Pivot Point S1 | 0.8868 |
| Daily Pivot Point S2 | 0.8859 |
| Daily Pivot Point S3 | 0.8847 |
| Daily Pivot Point R1 | 0.8889 |
| Daily Pivot Point R2 | 0.8901 |
| Daily Pivot Point R3 | 0.8910 |
[/s2If]
Join Our Telegram Group
")


