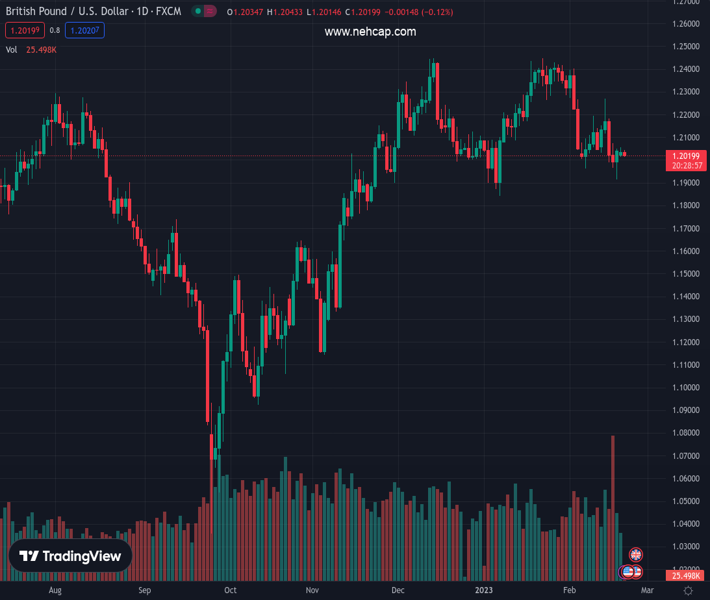
#GBPUSD @ 1.20205 takes offers to refresh intraday low after a sluggish start to the week. (Pivot Orderbook analysis)
…
This is a premium post.
[s2If !current_user_can(access_s2member_level4)]Please register for PREMIUM VERSION HERE to read full post below containing analysis. In case of any error or you think you are not able to read the full post below, please email us at support#nehcap.com [lwa][/s2If] [s2If current_user_can(access_s2member_level4)]
- GBP/USD takes offers to refresh intraday low after a sluggish start to the week.
- Return of full markets propels yields, renew US Dollar run-up.
- Looming fears over NI Brexit deal and the UK recession weigh on Cable price.
- UK/US PMIs eyed for fresh impulse, risk catalysts are important too.
The pair currently trades last at 1.20205.
The previous day high was 1.2057 while the previous day low was 1.2015. The daily 38.2% Fib levels comes at 1.2031, expected to provide resistance. Similarly, the daily 61.8% fib level is at 1.2041, expected to provide resistance.
GBP/USD renews intraday low near 1.2020 during early Tuesday morning as traders cheer the return of the Westerns traders, following an extended weekend due to the US holidays. In addition to the full market’s return, the Cable pair traders also portrays fears emanating from the Brexit deal negotiations and doubts over the small industries’ optimism.
Late on Monday, the UK Times came out with the news suggesting British Ministers are prepared to resign over (Prime Minister) Rishi Sunak’s Brexit deal if it risks Northern Ireland’s place within the UK. “There is a mounting backlash among Eurosceptic Conservative MPs to the deal,” mentioned The Times.
Elsewhere, The Times quotes Barclay’s industrial survey to state that bosses of small companies are increasingly upbeat about their prospects. The same adds to evidence that the outlook for the British economy may not be as bad as has been feared, mentioned the news.
Above all, fears of a monetary policy divergence between the Fed and the Bank of England (BoE), back by the week’s British mixed statistics and the strong US data, seem to weigh on the GBP/USD price.
That said, the US 10-year Treasury bond yields pick-up bids to near the highest levels marked since early November 2022, mildly bid around 3.86% at the latest.
It should be noted that the geopolitical fears emanating from China and Russia also seem to underpin the US Dollar’s safe-haven demand and weigh on the GBP/USD price.
Moving on, preliminary readings of the S&P Global PMIs for February will be crucial for the GBP/USD pair traders. That said, upbeat data from the UK becomes necessary to put a floor under the prices as the latest US Treasury bond yields’ moves favored the US Dollar ahead of the key US PMIs.
Although Monday’s Doji candlestick keeps GBP/USD bears hopeful, an upward-sloping support line from late November 2022, close to 1.1920 by the press time, puts a floor under the Cable pair.
Technical Levels: Supports and Resistances
GBPUSD currently trading at 1.2019 at the time of writing. Pair opened at 1.2036 and is trading with a change of -0.14 % .
| Overview | Overview.1 | |
|---|---|---|
| 0 | Today last price | 1.2019 |
| 1 | Today Daily Change | -0.0017 |
| 2 | Today Daily Change % | -0.1400 |
| 3 | Today daily open | 1.2036 |
The pair is trading below its 20 Daily moving average @ 1.218, below its 50 Daily moving average @ 1.2169 , above its 100 Daily moving average @ 1.191 and above its 200 Daily moving average @ 1.1939
| Trends | Trends.1 | |
|---|---|---|
| 0 | Daily SMA20 | 1.2180 |
| 1 | Daily SMA50 | 1.2169 |
| 2 | Daily SMA100 | 1.1910 |
| 3 | Daily SMA200 | 1.1939 |
The previous day high was 1.2057 while the previous day low was 1.2015. The daily 38.2% Fib levels comes at 1.2031, expected to provide resistance. Similarly, the daily 61.8% fib level is at 1.2041, expected to provide resistance.
Note the levels of interest below:
- Pivot support is noted at 1.2015, 1.1994, 1.1973
- Pivot resistance is noted at 1.2057, 1.2078, 1.2099
| Levels | Levels.1 |
|---|---|
| Previous Daily High | 1.2057 |
| Previous Daily Low | 1.2015 |
| Previous Weekly High | 1.2270 |
| Previous Weekly Low | 1.1915 |
| Previous Monthly High | 1.2448 |
| Previous Monthly Low | 1.1841 |
| Daily Fibonacci 38.2% | 1.2031 |
| Daily Fibonacci 61.8% | 1.2041 |
| Daily Pivot Point S1 | 1.2015 |
| Daily Pivot Point S2 | 1.1994 |
| Daily Pivot Point S3 | 1.1973 |
| Daily Pivot Point R1 | 1.2057 |
| Daily Pivot Point R2 | 1.2078 |
| Daily Pivot Point R3 | 1.2099 |
[/s2If]
Join Our Telegram Group
")


