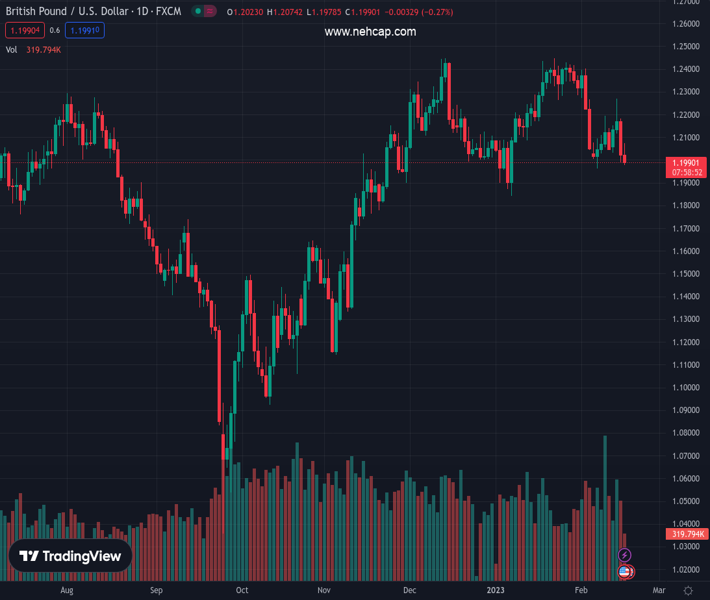
#GBPUSD @ 1.19864 comes under renewed selling pressure on Thursday and refreshes the weekly low. (Pivot Orderbook analysis)
…
This is a premium post.
[s2If !current_user_can(access_s2member_level4)]Please register for PREMIUM VERSION HERE to read full post below containing analysis. In case of any error or you think you are not able to read the full post below, please email us at support#nehcap.com [lwa][/s2If] [s2If current_user_can(access_s2member_level4)]
- GBP/USD comes under renewed selling pressure on Thursday and refreshes the weekly low.
- The emergence of fresh USD buying turns out to be a key factor dragging spot prices lower.
- The technical setup favours bearish traders and supports prospects for a further downfall.
The pair currently trades last at 1.19864.
The previous day high was 1.2182 while the previous day low was 1.199. The daily 38.2% Fib levels comes at 1.2063, expected to provide resistance. Similarly, the daily 61.8% fib level is at 1.2108, expected to provide resistance.
The GBP/USD pair attracts fresh selling following an intraday move up to the 1.2075 area and drops to a fresh daily low during the early North American session. The pair slips back below the 1.2000 psychological mark in the last hour and is now seen flirting with the weekly low touched on Wednesday.
The prospects for further policy tightening by the Fed, along with the risk-off impulse, assist the safe-haven US Dollar to recover a major part of its intraday losses. Furthermore, expectations that the Bank of England’s (BoE) current rate-hiking cycle is nearing the end continue to undermine the British Pound and act as a headwind for the GBP/USD pair.
From a technical perspective, spot prices this week struggled to find acceptance above the 50-day SMA and the overnight slump suggests that the near-term downtrend is still far from being over. The outlook is reinforced by the fact that oscillators on the daily chart are holding in the bearish territory and are still far from being in the oversold zone.
Hence, a subsequent slide towards challenging the very important 200-day SMA, currently around the 1.1940-1.1935 region, looks like a distinct possibility. Against the backdrop of a double-top formation near the 1.2445-1.2450 region, some follow-through selling will confirm a fresh bearish breakdown and set the stage for a further depreciating move.
The GBP/USD pair might then turn vulnerable to weaken further below the 1.1900 round-figure mark and accelerate the slide towards retesting the YTD low, around the 1.1840 region touched in January.
On the flip side, the 1.2060-1.2070 region now seems to act as an immediate hurdle ahead of the 1.2100 mark and the 1.2125-1.2130 horizontal zone. This is followed by the 50-day SMA, around the 1.2175 area, above which a fresh bout of a short-covering could lift the GBP/USD pair beyond the 1.2200 mark, towards the 1.2265-1.2270 region, or the weekly high.
Technical Levels: Supports and Resistances
GBPUSD currently trading at 1.2013 at the time of writing. Pair opened at 1.2034 and is trading with a change of -0.17 % .
| Overview | Overview.1 | |
|---|---|---|
| 0 | Today last price | 1.2013 |
| 1 | Today Daily Change | -0.0021 |
| 2 | Today Daily Change % | -0.1700 |
| 3 | Today daily open | 1.2034 |
The pair is trading below its 20 Daily moving average @ 1.2234, below its 50 Daily moving average @ 1.2183 , above its 100 Daily moving average @ 1.1885 and above its 200 Daily moving average @ 1.1942
| Trends | Trends.1 | |
|---|---|---|
| 0 | Daily SMA20 | 1.2234 |
| 1 | Daily SMA50 | 1.2183 |
| 2 | Daily SMA100 | 1.1885 |
| 3 | Daily SMA200 | 1.1942 |
The previous day high was 1.2182 while the previous day low was 1.199. The daily 38.2% Fib levels comes at 1.2063, expected to provide resistance. Similarly, the daily 61.8% fib level is at 1.2108, expected to provide resistance.
Note the levels of interest below:
- Pivot support is noted at 1.1955, 1.1876, 1.1762
- Pivot resistance is noted at 1.2147, 1.2261, 1.2339
| Levels | Levels.1 |
|---|---|
| Previous Daily High | 1.2182 |
| Previous Daily Low | 1.1990 |
| Previous Weekly High | 1.2194 |
| Previous Weekly Low | 1.1961 |
| Previous Monthly High | 1.2448 |
| Previous Monthly Low | 1.1841 |
| Daily Fibonacci 38.2% | 1.2063 |
| Daily Fibonacci 61.8% | 1.2108 |
| Daily Pivot Point S1 | 1.1955 |
| Daily Pivot Point S2 | 1.1876 |
| Daily Pivot Point S3 | 1.1762 |
| Daily Pivot Point R1 | 1.2147 |
| Daily Pivot Point R2 | 1.2261 |
| Daily Pivot Point R3 | 1.2339 |
[/s2If]
Join Our Telegram Group
")


