#NZDUSD @ 0.62976 stages an intraday recovery from mid-0.6200s amid a modest USD downtick. (Pivot Orderbook analysis)
…
This is a premium post.
[s2If !current_user_can(access_s2member_level4)]Please register for PREMIUM VERSION HERE to read full post below containing analysis. In case of any error or you think you are not able to read the full post below, please email us at support#nehcap.com [lwa][/s2If] [s2If current_user_can(access_s2member_level4)]
- NZD/USD stages an intraday recovery from mid-0.6200s amid a modest USD downtick.
- A positive risk tone undermines the safe-haven buck and benefits the risk-sensitive Kiwi.
- Hawkish Fed expectations should limit the USD losses and cap the upside for the major.
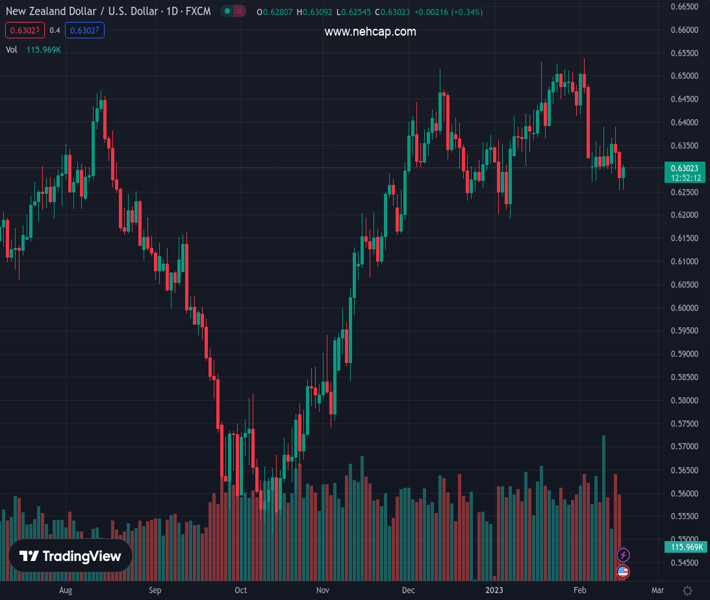
The pair currently trades last at 0.62976.
The previous day high was 0.6342 while the previous day low was 0.6252. The daily 38.2% Fib levels comes at 0.6286, expected to provide support. Similarly, the daily 61.8% fib level is at 0.6308, expected to provide resistance.
The NZD/USD pair attracts some buying in the vicinity of mid-0.6200s on Thursday and reverses a part of the previous day’s slide to its lowest level since January 6. The steady intraday ascent lifts spot prices to a fresh daily high, around the 0.6300 mark, during the first half of the European session, albeit lacks bullish conviction.
The US Dollar (USD) retreats from a six-week high touched on Wednesday amid a modest downtick in the US Treasury bond yields and turns out to be a key factor lending some support to the NZD/USD pair. Apart from this, a generally positive tone around the equity markets further undermines the safe-haven Greenback and benefits the risk-sensitive Kiwi. That said, the prospects for further policy tightening by the Fed should act as a tailwind for the US bond yields and limit losses for the USD.
Investors now seem convinced that the US central bank will stick to its hawkish stance for longer amid stubbornly high inflation. In fact, the markets are currently pricing in at least a 25 bps lift-off at each of the next two FOMC meetings in March and in May. Moreover, several FOMC policymakers, including Fed Chair Jerome Powell, recently stressed the need for additional interest rate hikes to fully gain control of inflation. This supports prospects for the emergence of some USD dip-buying.
Hence, it will be prudent to wait for strong follow-through buying before confirming that the NZD/USD pair’s recent pullback from its highest level since June 2022 has run its course. Market participants now look to the US economic docket, featuring the Producer Price Index (PPI), the usual Weekly Initial Jobless Claims, the Philly Fed Manufacturing Index, Building Permits and Housing Starts. This, along with the US bond yields, will influence the USD and provide some impetus to the major.
Technical Levels: Supports and Resistances
NZDUSD currently trading at 0.6297 at the time of writing. Pair opened at 0.6287 and is trading with a change of 0.16 % .
| Overview | Overview.1 | |
|---|---|---|
| 0 | Today last price | 0.6297 |
| 1 | Today Daily Change | 0.0010 |
| 2 | Today Daily Change % | 0.1600 |
| 3 | Today daily open | 0.6287 |
The pair is trading below its 20 Daily moving average @ 0.6405, below its 50 Daily moving average @ 0.6372 , above its 100 Daily moving average @ 0.6148 and above its 200 Daily moving average @ 0.6187
| Trends | Trends.1 | |
|---|---|---|
| 0 | Daily SMA20 | 0.6405 |
| 1 | Daily SMA50 | 0.6372 |
| 2 | Daily SMA100 | 0.6148 |
| 3 | Daily SMA200 | 0.6187 |
The previous day high was 0.6342 while the previous day low was 0.6252. The daily 38.2% Fib levels comes at 0.6286, expected to provide support. Similarly, the daily 61.8% fib level is at 0.6308, expected to provide resistance.
Note the levels of interest below:
- Pivot support is noted at 0.6245, 0.6204, 0.6155
- Pivot resistance is noted at 0.6335, 0.6384, 0.6425
| Levels | Levels.1 |
|---|---|
| Previous Daily High | 0.6342 |
| Previous Daily Low | 0.6252 |
| Previous Weekly High | 0.6391 |
| Previous Weekly Low | 0.6270 |
| Previous Monthly High | 0.6531 |
| Previous Monthly Low | 0.6190 |
| Daily Fibonacci 38.2% | 0.6286 |
| Daily Fibonacci 61.8% | 0.6308 |
| Daily Pivot Point S1 | 0.6245 |
| Daily Pivot Point S2 | 0.6204 |
| Daily Pivot Point S3 | 0.6155 |
| Daily Pivot Point R1 | 0.6335 |
| Daily Pivot Point R2 | 0.6384 |
| Daily Pivot Point R3 | 0.6425 |
[/s2If]
Join Our Telegram Group
")


