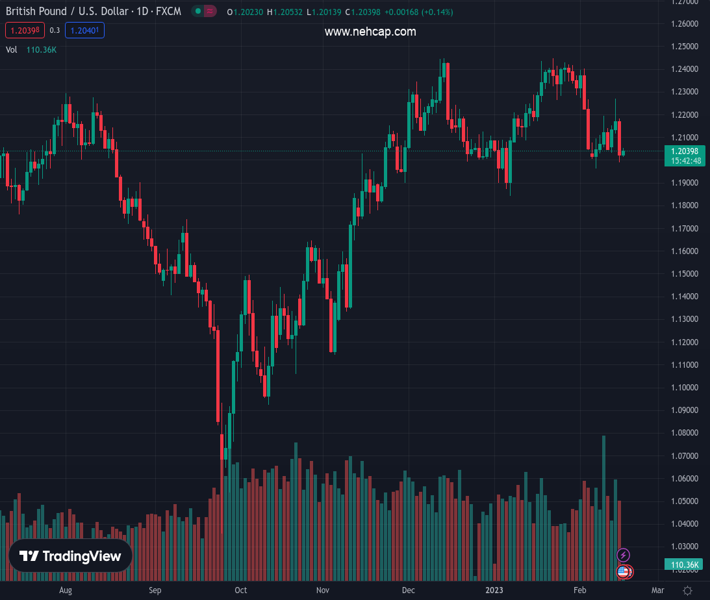
#GBPUSD @ 1.20383 prints mild gains while paring the biggest daily loss in a fortnight., @nehcap view: Further downside expected (Pivot Orderbook analysis)
…
This is a premium post.
[s2If !current_user_can(access_s2member_level4)]Please register for PREMIUM VERSION HERE to read full post below containing analysis. In case of any error or you think you are not able to read the full post below, please email us at support#nehcap.com [lwa][/s2If] [s2If current_user_can(access_s2member_level4)]
- GBP/USD prints mild gains while paring the biggest daily loss in a fortnight.
- Bearish chart formation contradicts bullish MACD signals to challenge immediate run-up.
- Sustained trading beyond 1.2080-85 resistance confluence needed to recall buyers.
The pair currently trades last at 1.20383.
The previous day high was 1.2182 while the previous day low was 1.199. The daily 38.2% Fib levels comes at 1.2063, expected to provide resistance. Similarly, the daily 61.8% fib level is at 1.2108, expected to provide resistance.
GBP/USD remains on the bear’s radar despite the latest rebound to 1.2050, up 0.15% intraday heading into Thursday’s London open. In doing so, the Cable pair struggles to justify the first daily gains in three while consolidating the heaviest slump in two weeks, marked the previous day.
That said, a three-day-old bearish flag chart formation joins the quote’s sustained trading below the weekly support line, now resistance, to keep sellers hopeful. It’s worth noting, however, that the bullish chart formation and the US Dollar’s retreat amid a sluggish session seem to challenge the Cable pair sellers.
As a result, the traders should wait for a clear downside break of the 1.2020 level, comprising the lower line of the flag, to initiate fresh entries.
Following that, January’s bottom surrounding 1.1840 may act as an intermediate halt during the theoretical slump targeting the mid-1.1700s.
Alternatively, the aforementioned support-turned-resistance line from February 07 joins the 200-Hour Moving Average (HMA) to highlight the 1.2080-85 as the short-term key upside hurdle.
In a case where the GBP/USD buyers manage to cross the 1.2085 resistance confluence, they not only defy the bearish chart formation but also strengthen the odds of a run-up toward the weekly top surrounding 1.2270.
Trend: Further downside expected
Technical Levels: Supports and Resistances
GBPUSD currently trading at 1.2047 at the time of writing. Pair opened at 1.2034 and is trading with a change of 0.11% % .
| Overview | Overview.1 | |
|---|---|---|
| 0 | Today last price | 1.2047 |
| 1 | Today Daily Change | 0.0013 |
| 2 | Today Daily Change % | 0.11% |
| 3 | Today daily open | 1.2034 |
The pair is trading below its 20 Daily moving average @ 1.2234, below its 50 Daily moving average @ 1.2183 , above its 100 Daily moving average @ 1.1885 and above its 200 Daily moving average @ 1.1942
| Trends | Trends.1 | |
|---|---|---|
| 0 | Daily SMA20 | 1.2234 |
| 1 | Daily SMA50 | 1.2183 |
| 2 | Daily SMA100 | 1.1885 |
| 3 | Daily SMA200 | 1.1942 |
The previous day high was 1.2182 while the previous day low was 1.199. The daily 38.2% Fib levels comes at 1.2063, expected to provide resistance. Similarly, the daily 61.8% fib level is at 1.2108, expected to provide resistance.
Note the levels of interest below:
- Pivot support is noted at 1.1955, 1.1876, 1.1762
- Pivot resistance is noted at 1.2147, 1.2261, 1.2339
| Levels | Levels.1 |
|---|---|
| Previous Daily High | 1.2182 |
| Previous Daily Low | 1.1990 |
| Previous Weekly High | 1.2194 |
| Previous Weekly Low | 1.1961 |
| Previous Monthly High | 1.2448 |
| Previous Monthly Low | 1.1841 |
| Daily Fibonacci 38.2% | 1.2063 |
| Daily Fibonacci 61.8% | 1.2108 |
| Daily Pivot Point S1 | 1.1955 |
| Daily Pivot Point S2 | 1.1876 |
| Daily Pivot Point S3 | 1.1762 |
| Daily Pivot Point R1 | 1.2147 |
| Daily Pivot Point R2 | 1.2261 |
| Daily Pivot Point R3 | 1.2339 |
[/s2If]
Join Our Telegram Group
")


