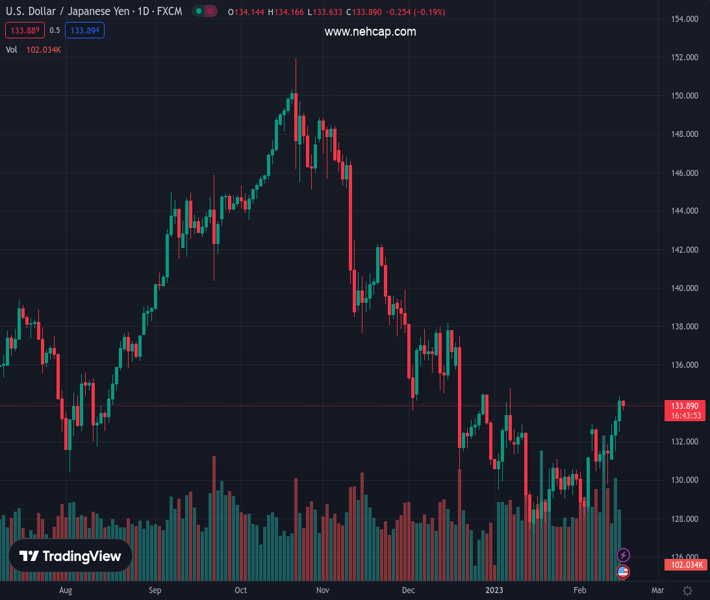
#USDJPY @ 133.911 snaps three-day uptrend as it retreats from six-week high., @nehcap view: Limited downside expected (Pivot Orderbook analysis)
…
This is a premium post.
[s2If !current_user_can(access_s2member_level4)]Please register for PREMIUM VERSION HERE to read full post below containing analysis. In case of any error or you think you are not able to read the full post below, please email us at support#nehcap.com [lwa][/s2If] [s2If current_user_can(access_s2member_level4)]
- USD/JPY snaps three-day uptrend as it retreats from six-week high.
- Convergence of one-month-old previous support line, ascending trend line from the last Friday challenges bears.
- Firmer oscillators add strength to the upside bias while 200-SMA acts as additional downside filter.
The pair currently trades last at 133.911.
The previous day high was 134.36 while the previous day low was 132.55. The daily 38.2% Fib levels comes at 133.67, expected to provide support. Similarly, the daily 61.8% fib level is at 133.24, expected to provide support.
USD/JPY prints the first loss-making day in four as bulls take a breather around the 1.5-month high during early Thursday. In doing so, the Yen pair flirts with the 133.60 support confluence heading into the European session.
Although the overbought RSI (14) triggered the USD/JPY retreat, a convergence of the resistance-turned-support line from January 18 and a one-week-old ascending trend line challenges the Yen pair sellers around 133.60. On the same line are the bullish MACD signals and the pair’s higher-low formation on the Daily chart.
It’s worth noting, however, that the quote’s further recovery needs validation from the 134.00 round figure to challenge the latest high of 134.35.
Following that, the previous peak of around 134.80 and the December 2022 top near 138.20 will be in focus.
On the flip side, a clear break of the 133.60 support confluence can quickly drag the USD/JPY price towards the 200-Simple Moving Average (SMA) support of 130.70.
Should the quote remains weak past 130.70, the 130.00 round figure and the previous weekly bottom surrounding 129.80 could please the USD/JPY bears before directing them to the one-month-old ascending support line, close to 129.00 by the press time.
Overall, USD/JPY remains on the bull’s radar despite the latest pullback from the multi-day high.
Trend: Limited downside expected
Technical Levels: Supports and Resistances
USDJPY currently trading at 133.84 at the time of writing. Pair opened at 134.11 and is trading with a change of -0.20% % .
| Overview | Overview.1 | |
|---|---|---|
| 0 | Today last price | 133.84 |
| 1 | Today Daily Change | -0.27 |
| 2 | Today Daily Change % | -0.20% |
| 3 | Today daily open | 134.11 |
The pair is trading above its 20 Daily moving average @ 130.78, above its 50 Daily moving average @ 132.05 , below its 100 Daily moving average @ 137.86 and below its 200 Daily moving average @ 136.87
| Trends | Trends.1 | |
|---|---|---|
| 0 | Daily SMA20 | 130.78 |
| 1 | Daily SMA50 | 132.05 |
| 2 | Daily SMA100 | 137.86 |
| 3 | Daily SMA200 | 136.87 |
The previous day high was 134.36 while the previous day low was 132.55. The daily 38.2% Fib levels comes at 133.67, expected to provide support. Similarly, the daily 61.8% fib level is at 133.24, expected to provide support.
Note the levels of interest below:
- Pivot support is noted at 132.99, 131.86, 131.17
- Pivot resistance is noted at 134.8, 135.48, 136.61
| Levels | Levels.1 |
|---|---|
| Previous Daily High | 134.36 |
| Previous Daily Low | 132.55 |
| Previous Weekly High | 132.91 |
| Previous Weekly Low | 129.81 |
| Previous Monthly High | 134.78 |
| Previous Monthly Low | 127.22 |
| Daily Fibonacci 38.2% | 133.67 |
| Daily Fibonacci 61.8% | 133.24 |
| Daily Pivot Point S1 | 132.99 |
| Daily Pivot Point S2 | 131.86 |
| Daily Pivot Point S3 | 131.17 |
| Daily Pivot Point R1 | 134.80 |
| Daily Pivot Point R2 | 135.48 |
| Daily Pivot Point R3 | 136.61 |
[/s2If]
Join Our Telegram Group
")


