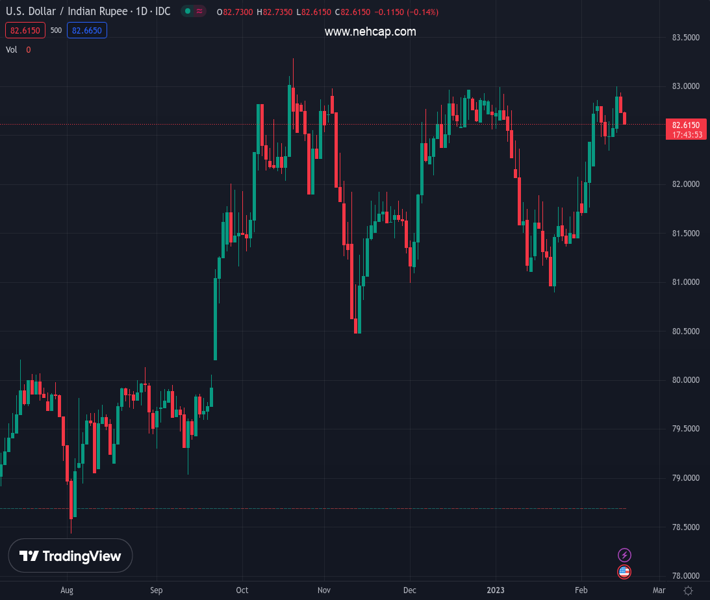
#USDINR @ 82.6400 extends pullback from four-month-old resistance line amid sluggish markets., @nehcap view: Limited downside expected (Pivot Orderbook analysis)
…
This is a premium post.
[s2If !current_user_can(access_s2member_level4)]Please register for PREMIUM VERSION HERE to read full post below containing analysis. In case of any error or you think you are not able to read the full post below, please email us at support#nehcap.com [lwa][/s2If] [s2If current_user_can(access_s2member_level4)]
- USD/INR extends pullback from four-month-old resistance line amid sluggish markets.
- US Dollar pares gains around six-week high as Treasury bond yields retreat.
- China-linked headlines also weigh on prices amid cautious optimism in Asia.
The pair currently trades last at 82.6400.
The previous day high was 83.0152 while the previous day low was 82.755. The daily 38.2% Fib levels comes at 82.8544, expected to provide resistance. Similarly, the daily 61.8% fib level is at 82.9158, expected to provide resistance.
USD/INR takes offers to refresh the intraday low near 82.65 while extending the previous day’s U-turn from the short-term key trend line resistance during early Thursday. In doing so, the Indian Rupee (INR) pair benefits from the mildly positive sentiment in Asia, as well as the US Dollar’s pullback from a six-week high marked on Wednesday.
Risk appetite improves in Asia, despite looming Fed concerns and mixed headlines from China, not to forget the US debt ceiling woes. The reason could be linked to a retreat in the US Treasury bond yields. Earlier in the day, China President Xi Jinping crossed wires while showing readiness to deepen industrial and investment cooperation with Asia. Following him were upbeat comments from Chinese Finance Minister Liu Kun who said that the 2023 fiscal revenue will grow this year, though the growth rate will not be too high, per the Chinese state media.
Elsewhere, fears of witnessing the US debt-ceiling crisis, as warned by the US Congressional Budget Office (CBO) on Wednesday per Reuters, suggested a faster solution to the big problem in the upcoming days and probed the US Treasury bond yields’ upside.
Amid these plays, the S&P 500 Futures print mild gains around 4,165 while extending the previous day’s gains whereas the US 10-year Treasury bond yields retreat following the run-up to a 1.5-month high marked on Wednesday, down two basis points to near 3.78% by the press time.
It’s worth noting that the recently firmer Oil prices and the US-data-backed hawkish expectations from the Federal Reserve (Fed) can probe the USD/INR bears ahead of the second-tier US data concerning the housing market, industrial activity and producer prices.
USD/INR portrays a clear U-turn from a downward-sloping resistance line from October 19, poking the 10-DMA support amid easing the bullish bias of the MACD by the press time.
With this, the Indian Rupee (INR) pair is likely declining toward a three-week-old ascending support line, close to 82.50 by the press time.
However, the USD/INR bears should remain worried unless witnessing a clear downside break of the 50-DMA support of 82.24.
Meanwhile, the USD/INR recovery needs validation from the four-month-old descending trend line, around the 83.00 round figure at the latest, to recall the pair buyers.
Trend: Limited downside expected
Technical Levels: Supports and Resistances
USDINR currently trading at 82.6375 at the time of writing. Pair opened at 82.7622 and is trading with a change of -0.15% % .
| Overview | Overview.1 | |
|---|---|---|
| 0 | Today last price | 82.6375 |
| 1 | Today Daily Change | -0.1247 |
| 2 | Today Daily Change % | -0.15% |
| 3 | Today daily open | 82.7622 |
The pair remains strongly bullish on the daily timeframe. It trades above its 20 SMA @ 82.0434, 50 SMA 82.2373, 100 SMA @ 82.0842 and 200 SMA @ 80.5759.
| Trends | Trends.1 | |
|---|---|---|
| 0 | Daily SMA20 | 82.0434 |
| 1 | Daily SMA50 | 82.2373 |
| 2 | Daily SMA100 | 82.0842 |
| 3 | Daily SMA200 | 80.5759 |
The previous day high was 83.0152 while the previous day low was 82.755. The daily 38.2% Fib levels comes at 82.8544, expected to provide resistance. Similarly, the daily 61.8% fib level is at 82.9158, expected to provide resistance.
Note the levels of interest below:
- Pivot support is noted at 82.6731, 82.584, 82.413
- Pivot resistance is noted at 82.9333, 83.1043, 83.1934
| Levels | Levels.1 |
|---|---|
| Previous Daily High | 83.0152 |
| Previous Daily Low | 82.7550 |
| Previous Weekly High | 82.9399 |
| Previous Weekly Low | 82.1626 |
| Previous Monthly High | 83.0720 |
| Previous Monthly Low | 80.8822 |
| Daily Fibonacci 38.2% | 82.8544 |
| Daily Fibonacci 61.8% | 82.9158 |
| Daily Pivot Point S1 | 82.6731 |
| Daily Pivot Point S2 | 82.5840 |
| Daily Pivot Point S3 | 82.4130 |
| Daily Pivot Point R1 | 82.9333 |
| Daily Pivot Point R2 | 83.1043 |
| Daily Pivot Point R3 | 83.1934 |
[/s2If]
Join Our Telegram Group
")


