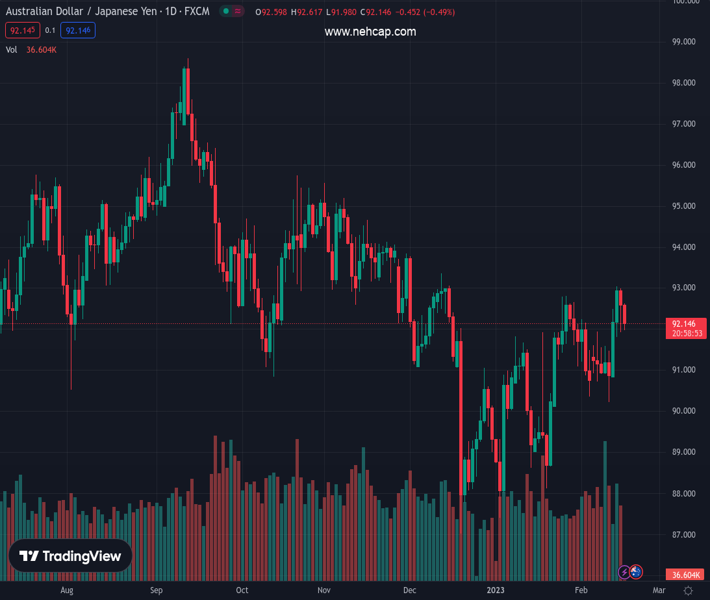
#AUDJPY @ 92.1380 drops 50 pips as Australia inflation, employment numbers disappoint Aussie buyers., @nehcap view: Further downside expected (Pivot Orderbook analysis)
…
This is a premium post.
[s2If !current_user_can(access_s2member_level4)]Please register for PREMIUM VERSION HERE to read full post below containing analysis. In case of any error or you think you are not able to read the full post below, please email us at support#nehcap.com [lwa][/s2If] [s2If current_user_can(access_s2member_level4)]
- AUD/JPY drops 50 pips as Australia inflation, employment numbers disappoint Aussie buyers.
- Looming bear cross on MACD adds strength to the downside bias.
- 100-EMA, 200-EMA challenge bears before directing them to monthly low.
The pair currently trades last at 92.1380.
The previous day high was 93.06 while the previous day low was 91.92. The daily 38.2% Fib levels comes at 92.36, expected to provide resistance. Similarly, the daily 61.8% fib level is at 92.63, expected to provide resistance.
AUD/JPY lures sellers with an interesting head-and-shoulders bearish chart pattern following the downbeat prints of Australia’s inflation and employment numbers during early Thursday. That said, the cross-currency pair dropped nearly 50 pips to refresh an intraday low of around 92.00 by the press time.
Also read: AUD/USD plummets below 0.6900 on downbeat Aussie inflation, employment data
Not only the weekly bearish chart formation but the looming bear cross on the MACD also highlights the pair’s importance for the sellers.
However, a clear downside break of the stated pattern’s neckline, around 91.95 by the press time becomes necessary to confirm the theoretical south-run towards the 90.70 levels.
It should be noted that the 100 and 200-bar Exponential Moving Averages (EMAs) could challenge the AUD/JPY bears around 92.00 and 91.75 respectively while the monthly low surrounding 90.20 and the 90.00 round figure may please the sellers past the theoretical target.
Alternatively, recovery moves remain elusive unless the quote remains below the recent swing high of 92.67.
Even so, the monthly peak of 93.06 and the mid-December 2022 swing high of 93.35 could probe the AUD/JPY bulls.
In a case where the AUD/JPY price remains firmer past 93.35, the 94.00 round figure and October 2022 high near 95.75 will be in the spotlight.
Trend: Further downside expected
Technical Levels: Supports and Resistances
AUDJPY currently trading at 92.01 at the time of writing. Pair opened at 92.64 and is trading with a change of -0.68% % .
| Overview | Overview.1 | |
|---|---|---|
| 0 | Today last price | 92.01 |
| 1 | Today Daily Change | -0.63 |
| 2 | Today Daily Change % | -0.68% |
| 3 | Today daily open | 92.64 |
The pair is trading above its 20 Daily moving average @ 91.55, above its 50 Daily moving average @ 90.88 , below its 100 Daily moving average @ 92.19 and below its 200 Daily moving average @ 93.03
| Trends | Trends.1 | |
|---|---|---|
| 0 | Daily SMA20 | 91.55 |
| 1 | Daily SMA50 | 90.88 |
| 2 | Daily SMA100 | 92.19 |
| 3 | Daily SMA200 | 93.03 |
The previous day high was 93.06 while the previous day low was 91.92. The daily 38.2% Fib levels comes at 92.36, expected to provide resistance. Similarly, the daily 61.8% fib level is at 92.63, expected to provide resistance.
Note the levels of interest below:
- Pivot support is noted at 92.02, 91.4, 90.88
- Pivot resistance is noted at 93.16, 93.68, 94.3
| Levels | Levels.1 |
|---|---|
| Previous Daily High | 93.06 |
| Previous Daily Low | 91.92 |
| Previous Weekly High | 91.96 |
| Previous Weekly Low | 90.24 |
| Previous Monthly High | 92.82 |
| Previous Monthly Low | 87.41 |
| Daily Fibonacci 38.2% | 92.36 |
| Daily Fibonacci 61.8% | 92.63 |
| Daily Pivot Point S1 | 92.02 |
| Daily Pivot Point S2 | 91.40 |
| Daily Pivot Point S3 | 90.88 |
| Daily Pivot Point R1 | 93.16 |
| Daily Pivot Point R2 | 93.68 |
| Daily Pivot Point R3 | 94.30 |
[/s2If]
Join Our Telegram Group
")


