#USDCAD @ 1.33908 remains depressed after reversing from weekly top., @nehcap view: Further upside expected (Pivot Orderbook analysis)
…
This is a premium post.
[s2If !current_user_can(access_s2member_level4)]Please register for PREMIUM VERSION HERE to read full post below containing analysis. In case of any error or you think you are not able to read the full post below, please email us at support#nehcap.com [lwa][/s2If] [s2If current_user_can(access_s2member_level4)]
- USD/CAD remains depressed after reversing from weekly top.
- Bullish MACD signals, upbeat RSI keeps buyers hopeful.
- Symmetrical triangle restricts immediate moves between 1.3450 and 1.3340.
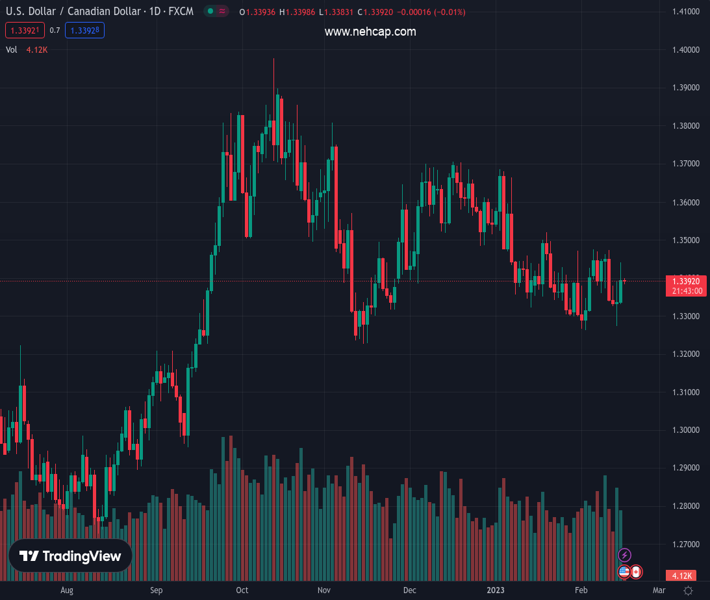
The pair currently trades last at 1.33908.
The previous day high was 1.3391 while the previous day low was 1.3274. The daily 38.2% Fib levels comes at 1.3346, expected to provide support. Similarly, the daily 61.8% fib level is at 1.3319, expected to provide support.
USD/CAD holds lower ground near 1.3390 during early Thursday morning in Asia, after positing the biggest daily gains in a fortnight to refresh the weekly top the previous day.
In doing so, the Loonie pair declines towards the 100-bar Simple Moving Average (SMA) inside a monthly symmetrical triangle formation, currently between 1.3450 and 1.3340.
It’s worth noting, however, that the bullish MACD signals and the firmer RSI keeps the USD/CAD buyers hopeful.
That said, a clear upside break of the stated triangle’s top line, close to 1.3450 at the latest, becomes necessary to convince the bulls.
Following that, a run-up towards the monthly high of 1.3475 and then to a late January peak of 1.3520 can’t be ruled out.
In a case where the USD/CAD price remains firmer past 1.3520, the odds of witnessing a rally toward the year-start top near 1.3685 can’t be ruled out.
On the flip side, a clear break of the 100-SMA, around 1.3370 at the latest, becomes necessary for the USD/CAD bears to keep the reins. Even so, the stated triangle’s bottom surrounding 1.3340 could challenge the Loonie pair’s further declines.
Should the quote remains bearish past 1.3340, it becomes vulnerable to refresh the monthly low, near 1.3260 at the latest.
Trend: Further upside expected
Technical Levels: Supports and Resistances
USDCAD currently trading at 1.3392 at the time of writing. Pair opened at 1.3338 and is trading with a change of 0.40% % .
| Overview | Overview.1 | |
|---|---|---|
| 0 | Today last price | 1.3392 |
| 1 | Today Daily Change | 0.0054 |
| 2 | Today Daily Change % | 0.40% |
| 3 | Today daily open | 1.3338 |
The pair is trading above its 20 Daily moving average @ 1.3379, below its 50 Daily moving average @ 1.3481 , below its 100 Daily moving average @ 1.3525 and above its 200 Daily moving average @ 1.3239
| Trends | Trends.1 | |
|---|---|---|
| 0 | Daily SMA20 | 1.3379 |
| 1 | Daily SMA50 | 1.3481 |
| 2 | Daily SMA100 | 1.3525 |
| 3 | Daily SMA200 | 1.3239 |
The previous day high was 1.3391 while the previous day low was 1.3274. The daily 38.2% Fib levels comes at 1.3346, expected to provide support. Similarly, the daily 61.8% fib level is at 1.3319, expected to provide support.
Note the levels of interest below:
- Pivot support is noted at 1.3277, 1.3217, 1.316
- Pivot resistance is noted at 1.3394, 1.3451, 1.3511
| Levels | Levels.1 |
|---|---|
| Previous Daily High | 1.3391 |
| Previous Daily Low | 1.3274 |
| Previous Weekly High | 1.3476 |
| Previous Weekly Low | 1.3338 |
| Previous Monthly High | 1.3685 |
| Previous Monthly Low | 1.3300 |
| Daily Fibonacci 38.2% | 1.3346 |
| Daily Fibonacci 61.8% | 1.3319 |
| Daily Pivot Point S1 | 1.3277 |
| Daily Pivot Point S2 | 1.3217 |
| Daily Pivot Point S3 | 1.3160 |
| Daily Pivot Point R1 | 1.3394 |
| Daily Pivot Point R2 | 1.3451 |
| Daily Pivot Point R3 | 1.3511 |
[/s2If]
Join Our Telegram Group
")


