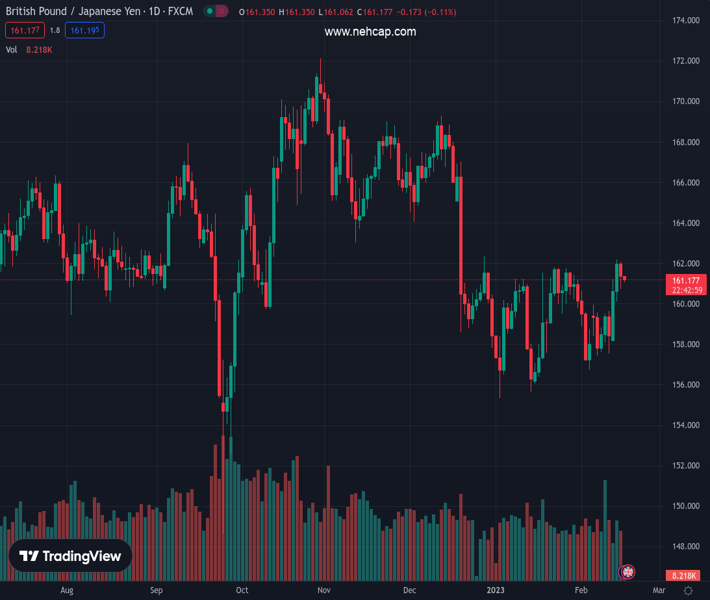
#GBPJPY @ 161.159 bulls failed to conquer the 200-day EMA at 161.81 and erased their earlier gains. (Pivot Orderbook analysis)
…
This is a premium post.
[s2If !current_user_can(access_s2member_level4)]Please register for PREMIUM VERSION HERE to read full post below containing analysis. In case of any error or you think you are not able to read the full post below, please email us at support#nehcap.com [lwa][/s2If] [s2If current_user_can(access_s2member_level4)]
- GBP/JPY bulls failed to conquer the 200-day EMA at 161.81 and erased their earlier gains.
- GBP/JPY Price Analysis: A bearish flag emerged at the 1-hour chart, which paved the way for further downside.
The pair currently trades last at 161.159.
The previous day high was 162.18 while the previous day low was 160.11. The daily 38.2% Fib levels comes at 161.39, expected to provide resistance. Similarly, the daily 61.8% fib level is at 160.9, expected to provide support.
The GBP/JPY retreats after reaching weekly highs at 161.46 and drops beneath 161.30 as Thursday’s Asian Pacific session begins. Even though the GBP/JPY remains upward biased unless it breaks crucial support levels. At the time of writing, the GBP/JPY exchanges hands at 161.27, below its opening price by a minuscule 0.05%.
From a daily chart perspective, the GBP/JPY is neutral biased, though an uptick toward 161.81, which would put into play the 200-day Exponential Moving Average (EMA). A break of resistance and the 100-day EMA at 161.98 would be next, ahead of 162.00. Once all those supply areas are hurdled, the GBP/JPY would rally towards 163.00, ahead of the December 20 daily high at 167.02.
In the meantime, the GBP/JPY 1-hour chart suggests the pair as neutral biased, though slightly tilted downwards, as a bearish flag emerged. In addition, the Relative Strength Index (RSI) turned bearish, while the Rate of Change (RoC) depicted that buying pressure waned.
Hence, the GBP/JPY Is poised downwards. The first demand zone to be tested would be the 50-EMA at 161.04. A breach of the latter and the GBP/JPY pair would fall to the bottom of the bearish flag at 160.72. Once cleared, GBP/JPY prices would be driven toward the 100-EMA at 161.49, ahead of the 200-EMA At 159.95.
Technical Levels: Supports and Resistances
GBPJPY currently trading at 161.24 at the time of writing. Pair opened at 162.0 and is trading with a change of -0.47 % .
| Overview | Overview.1 | |
|---|---|---|
| 0 | Today last price | 161.24 |
| 1 | Today Daily Change | -0.76 |
| 2 | Today Daily Change % | -0.47 |
| 3 | Today daily open | 162.00 |
The pair is trading above its 20 Daily moving average @ 159.86, above its 50 Daily moving average @ 160.97 , below its 100 Daily moving average @ 163.56 and below its 200 Daily moving average @ 163.23
| Trends | Trends.1 | |
|---|---|---|
| 0 | Daily SMA20 | 159.86 |
| 1 | Daily SMA50 | 160.97 |
| 2 | Daily SMA100 | 163.56 |
| 3 | Daily SMA200 | 163.23 |
The previous day high was 162.18 while the previous day low was 160.11. The daily 38.2% Fib levels comes at 161.39, expected to provide resistance. Similarly, the daily 61.8% fib level is at 160.9, expected to provide support.
Note the levels of interest below:
- Pivot support is noted at 160.68, 159.36, 158.61
- Pivot resistance is noted at 162.75, 163.5, 164.82
| Levels | Levels.1 |
|---|---|
| Previous Daily High | 162.18 |
| Previous Daily Low | 160.11 |
| Previous Weekly High | 159.96 |
| Previous Weekly Low | 157.43 |
| Previous Monthly High | 161.85 |
| Previous Monthly Low | 155.36 |
| Daily Fibonacci 38.2% | 161.39 |
| Daily Fibonacci 61.8% | 160.90 |
| Daily Pivot Point S1 | 160.68 |
| Daily Pivot Point S2 | 159.36 |
| Daily Pivot Point S3 | 158.61 |
| Daily Pivot Point R1 | 162.75 |
| Daily Pivot Point R2 | 163.50 |
| Daily Pivot Point R3 | 164.82 |
[/s2If]
Join Our Telegram Group
")


