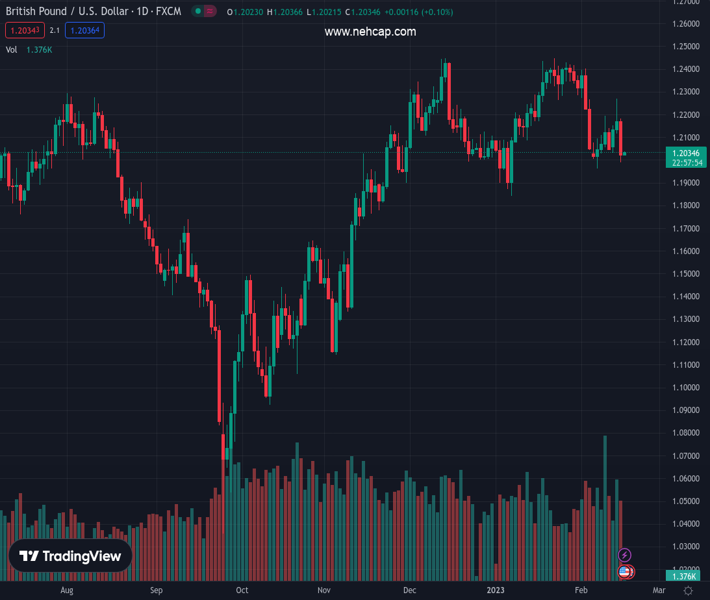
#GBPUSD @ 1.20298 consolidates the biggest daily loss in a fortnight around weekly low., @nehcap view: Limited downside expected (Pivot Orderbook analysis)
…
This is a premium post.
[s2If !current_user_can(access_s2member_level4)]Please register for PREMIUM VERSION HERE to read full post below containing analysis. In case of any error or you think you are not able to read the full post below, please email us at support#nehcap.com [lwa][/s2If] [s2If current_user_can(access_s2member_level4)]
- GBP/USD consolidates the biggest daily loss in a fortnight around weekly low.
- Ascending trend lines from January and last November precede 200-DMA to challenge bears.
- U-turn from 50-DMA, bearish MACD signals favor sellers.
The pair currently trades last at 1.20298.
The previous day high was 1.227 while the previous day low was 1.2118. The daily 38.2% Fib levels comes at 1.2212, expected to provide resistance. Similarly, the daily 61.8% fib level is at 1.2176, expected to provide resistance.
GBP/USD stays defensive around 1.2030, bouncing off the weekly low, as it licks the previous day’s wounds during early Thursday.
In doing so, the Cable pair rebounds from a six-week-old support line after falling the most in a fortnight. The recovery moves, however, remain elusive considering the quote’s sustained U-turn from the 50-DMA and the bearish MACD signals.
It’s worth noting, though, that the ascending support lines from early January and mid-November 2022, respectively around 1.2000 and 1.1985 in that order, restrict the short-term downside of the GBP/USD pair.
Following that, the 200-DMA level of 1.1940 gains the major attention of the bears targeting the mid-November 2022 bottom around 1.1760. However, the previous monthly low surrounding 1.1840 could offer an intermediate halt during the fall.
Meanwhile, GBP/USD rebound recovery remains elusive unless crossing the 50-DMA hurdle of near 1.2180.
In a case where the GBP/USD price remains firmer past 50-DMA, a one-month-old horizontal resistance near 1.2260 will be in focus as it holds the key for the Cable pair’s run-up toward the multiple tops marked since late 2022 around 1.2450.
Overall, GBP/USD is likely to remain depressed but the downside room appears limited.
Trend: Limited downside expected
Technical Levels: Supports and Resistances
GBPUSD currently trading at 1.2034 at the time of writing. Pair opened at 1.2177 and is trading with a change of -1.17% % .
| Overview | Overview.1 | |
|---|---|---|
| 0 | Today last price | 1.2034 |
| 1 | Today Daily Change | -0.0143 |
| 2 | Today Daily Change % | -1.17% |
| 3 | Today daily open | 1.2177 |
The pair is trading below its 20 Daily moving average @ 1.2249, below its 50 Daily moving average @ 1.2186 , above its 100 Daily moving average @ 1.1874 and above its 200 Daily moving average @ 1.1943
| Trends | Trends.1 | |
|---|---|---|
| 0 | Daily SMA20 | 1.2249 |
| 1 | Daily SMA50 | 1.2186 |
| 2 | Daily SMA100 | 1.1874 |
| 3 | Daily SMA200 | 1.1943 |
The previous day high was 1.227 while the previous day low was 1.2118. The daily 38.2% Fib levels comes at 1.2212, expected to provide resistance. Similarly, the daily 61.8% fib level is at 1.2176, expected to provide resistance.
Note the levels of interest below:
- Pivot support is noted at 1.2107, 1.2036, 1.1954
- Pivot resistance is noted at 1.2259, 1.234, 1.2411
| Levels | Levels.1 |
|---|---|
| Previous Daily High | 1.2270 |
| Previous Daily Low | 1.2118 |
| Previous Weekly High | 1.2194 |
| Previous Weekly Low | 1.1961 |
| Previous Monthly High | 1.2448 |
| Previous Monthly Low | 1.1841 |
| Daily Fibonacci 38.2% | 1.2212 |
| Daily Fibonacci 61.8% | 1.2176 |
| Daily Pivot Point S1 | 1.2107 |
| Daily Pivot Point S2 | 1.2036 |
| Daily Pivot Point S3 | 1.1954 |
| Daily Pivot Point R1 | 1.2259 |
| Daily Pivot Point R2 | 1.2340 |
| Daily Pivot Point R3 | 1.2411 |
[/s2If]
Join Our Telegram Group
")


