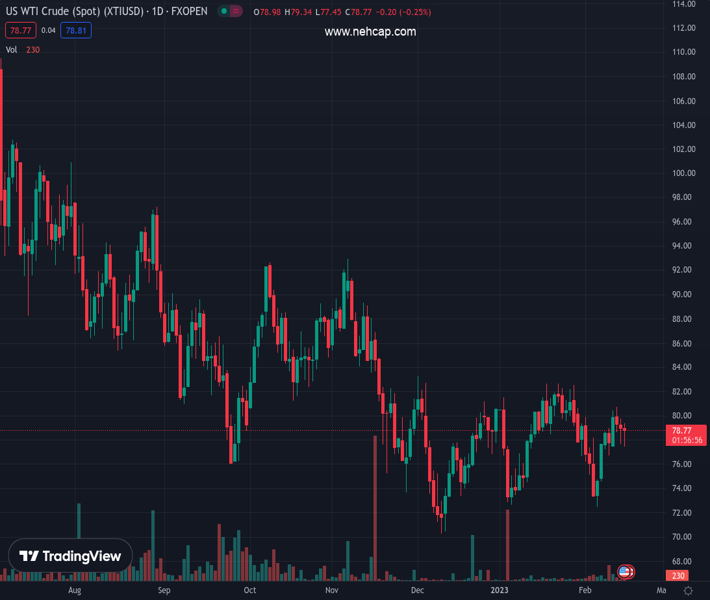
WTI extended its losses to three consecutive days beneath $80.00 a barrel. (Pivot Orderbook analysis)
…
This is a premium post.
[s2If !current_user_can(access_s2member_level4)]Please register for PREMIUM VERSION HERE to read full post below containing analysis. In case of any error or you think you are not able to read the full post below, please email us at support#nehcap.com [lwa][/s2If] [s2If current_user_can(access_s2member_level4)]
- WTI extended its losses to three consecutive days beneath $80.00 a barrel.
- US EIA reported that stockpiles had risen the most since June 2021.
- WTI Price Analysis: Subdued but it remains slightly tilted to the downside.
The pair currently trades last at 78.81.
The previous day high was 79.82 while the previous day low was 77.7. The daily 38.2% Fib levels comes at 78.51, expected to provide support. Similarly, the daily 61.8% fib level is at 79.01, expected to provide resistance.
Western Texas Intermediate (WTI), the US crude oil benchmark, is extending its fall to three straight days of consecutive losses, weighed by crude oil inventories in the United States (US) jumping more than estimates. Speculations of further interest rate hikes by the US Federal Reserve (Fed) bolstered the greenback, a headwind for oil prices. At the time of writing, WTI is trading at $78.40.
WTI is climbing above the 50-day Exponential Moving Average (EMA) even though US crude oil inventories have risen the most since June 2021. The US Energy Information Administration (EIA) agency revealed that crude stockpiles increased by 16.3 million barrels, in the week of February 10, to 471.4 million barrels.
Crude inventories in Cushing, Oklahoma, a delivery hub for futures, jumped by 659K last week, while refinery crude fell by 383K barrels per day. Gasoline inventories advanced by 2.3 million barrels to 241.9 million, exceeding analysts’ estimates of a 1.5 million barrels rise. Distillate inventories which account for diesel and heating oil, dropped by 1.3 million to 119.2 million, vs. expectations for a 400K barrel increase.
Aside from this, US Retail Sales for January smashed expectations and exceeded estimates. Therefore, recent Fed hawkish commentary, following Tuesday’s CPI print and today’s data, sparked speculation that the Federal Reserve would continue to tighten conditions, a tailwind for the greenback.
Albeit WTI remains neutral to downward biased, it remains consolidated in the $77.30-$80.50 range. The Relative Strength Index (RSI) in the bullish territory is almost flat, portraying oil as rangebound. In contrast, the Rate of Change (RoC) portrays sellers gaining momentum. Therefore, mixed signals suggest caution is warranted.
For WTI to resume its uptrend, it will need to conquer $80.50, which would open the door to test the 100 and 200-day EMAs, each at $81.43 and $85.00. As an alternate scenario, oil prices would resume their downtrend, with a decisive break below $77.00, dragging prices towards the YTD Low at $72.30.
Technical Levels: Supports and Resistances
XTIUSD currently trading at 78.81 at the time of writing. Pair opened at 79.37 and is trading with a change of -0.71 % .
| Overview | Overview.1 | |
|---|---|---|
| 0 | Today last price | 78.81 |
| 1 | Today Daily Change | -0.56 |
| 2 | Today Daily Change % | -0.71 |
| 3 | Today daily open | 79.37 |
The pair is trading below its 20 Daily moving average @ 78.82, above its 50 Daily moving average @ 77.61 , below its 100 Daily moving average @ 80.91 and below its 200 Daily moving average @ 89.86
| Trends | Trends.1 | |
|---|---|---|
| 0 | Daily SMA20 | 78.82 |
| 1 | Daily SMA50 | 77.61 |
| 2 | Daily SMA100 | 80.91 |
| 3 | Daily SMA200 | 89.86 |
The previous day high was 79.82 while the previous day low was 77.7. The daily 38.2% Fib levels comes at 78.51, expected to provide support. Similarly, the daily 61.8% fib level is at 79.01, expected to provide resistance.
Note the levels of interest below:
- Pivot support is noted at 78.11, 76.85, 76.0
- Pivot resistance is noted at 80.22, 81.07, 82.33
| Levels | Levels.1 |
|---|---|
| Previous Daily High | 79.82 |
| Previous Daily Low | 77.70 |
| Previous Weekly High | 80.48 |
| Previous Weekly Low | 72.50 |
| Previous Monthly High | 82.68 |
| Previous Monthly Low | 72.64 |
| Daily Fibonacci 38.2% | 78.51 |
| Daily Fibonacci 61.8% | 79.01 |
| Daily Pivot Point S1 | 78.11 |
| Daily Pivot Point S2 | 76.85 |
| Daily Pivot Point S3 | 76.00 |
| Daily Pivot Point R1 | 80.22 |
| Daily Pivot Point R2 | 81.07 |
| Daily Pivot Point R3 | 82.33 |
[/s2If]
Join Our Telegram Group
")


