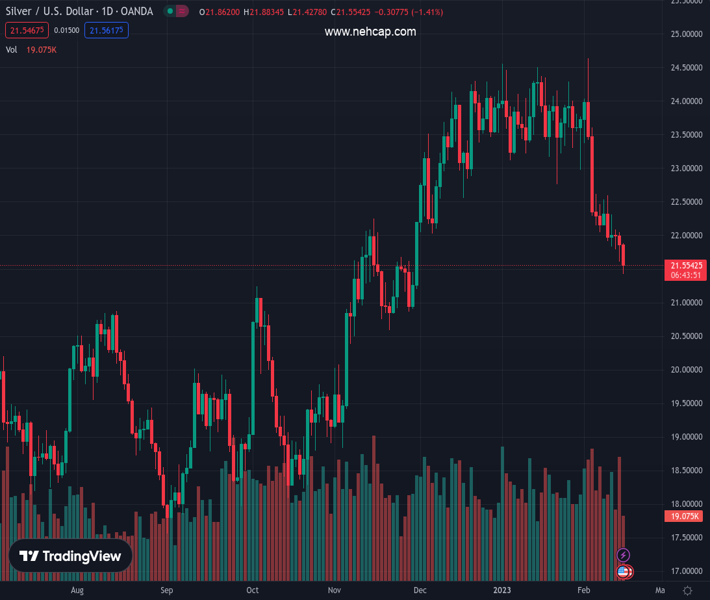
#XAGUSD @ 21.550 Silver drops below the 200-day EMA, extending its losses to two straight days. (Pivot Orderbook analysis)
…
This is a premium post.
[s2If !current_user_can(access_s2member_level4)]Please register for PREMIUM VERSION HERE to read full post below containing analysis. In case of any error or you think you are not able to read the full post below, please email us at support#nehcap.com [lwa][/s2If] [s2If current_user_can(access_s2member_level4)]
- Silver drops below the 200-day EMA, extending its losses to two straight days.
- Stronger-than-estimated Retail Sales augmented appetite for the US Dollar.
- XAG/USD Price Analysis: Turned bearish once it distanced from the 200-day EMA, eyeing the $21.00 mark.
The pair currently trades last at 21.550.
The previous day high was 22.04 while the previous day low was 21.61. The daily 38.2% Fib levels comes at 21.77, expected to provide resistance. Similarly, the daily 61.8% fib level is at 21.88, expected to provide resistance.
Silver price extended its losses for the second consecutive day and distanced from the 200-day Exponential Moving Average (EMA) resting at $21.50, as US economic data from the Commerce Department revealed that Retail Sales improved. Therefore, the US Dollar (USD) it’s making its case for a comeback. At the time of writing, the XAG/USD exchanges hands at $21.50 after hitting a high of $21.87.
The XAG/USD continues to dive, weighed by the strength of the greenback, which, underpinned by rising US Treasury bond yields, advances 0.64%, at 103.93, per the US Dollar Index. The 10-year US Treasury bond yield is up three and a half bps, up at 3.772%, a headwind for the non-yielding metal.
US Retails Sales for January jumped by an astonishing 3.0% MoM vs. estimates of 1.8% by analysts after two consecutive months of shrinkage. The increase in sales it’s mainly attributed to a tight labor market, which continues to generate strong wage growth, while higher gasoline prices might have inflated receipts at service stations.
Of late, Industrial Production (IP) in the US remained unchanged, as reported by the US Federal Reserve (Fed), while output was weaker than foreseen, spurred by higher borrowing costs in the manufacturing sector.
Given the backdrop, the US Federal Reserve might continue to tighten monetary conditions, with markets estimating two additional rate hikes of 25 bps, which would drag the Federal Funds Rate (FFR) to the 5.0%-5.25% range. On Tuesday, a slew of Fed policymakers commented that the Fed is not done hiking rates and emphasized what Fed Chair Powell said, that interest rates would remain “higher for longer.”
Hence, Silver prices would remain pressured, as a strong greenback would continue to hurt the white metal prospects. With the Federal Reserve set to cut rates until 2024, the white metal could see a bounce once the Fed pauses its tightening cycle. Nevertheless, a hawkish Fed would bolster the US Dollar prospects in the short term.
After dropping beneath the 200-day EMA, XAG/USD might extend its fall toward the November 28 swing low at $20.87, followed by November 21 at $20.59. A breach of those demand areas, and Silver, might head to the $20.00 psychological barrier, followed by the November monthly low of $19.42. Backing the previously mentioned are oscillators, with the Relative Strength Index (RSI) remaining at bearish territory, while the Rate of Change (RoC) suggests that sellers are gathering momentum.
Technical Levels: Supports and Resistances
XAGUSD currently trading at 21.53 at the time of writing. Pair opened at 21.88 and is trading with a change of -1.6 % .
| Overview | Overview.1 | |
|---|---|---|
| 0 | Today last price | 21.53 |
| 1 | Today Daily Change | -0.35 |
| 2 | Today Daily Change % | -1.60 |
| 3 | Today daily open | 21.88 |
The pair is trading below its 20 Daily moving average @ 23.07, below its 50 Daily moving average @ 23.42 , below its 100 Daily moving average @ 21.9 and above its 200 Daily moving average @ 21.01
| Trends | Trends.1 | |
|---|---|---|
| 0 | Daily SMA20 | 23.07 |
| 1 | Daily SMA50 | 23.42 |
| 2 | Daily SMA100 | 21.90 |
| 3 | Daily SMA200 | 21.01 |
The previous day high was 22.04 while the previous day low was 21.61. The daily 38.2% Fib levels comes at 21.77, expected to provide resistance. Similarly, the daily 61.8% fib level is at 21.88, expected to provide resistance.
Note the levels of interest below:
- Pivot support is noted at 21.65, 21.41, 21.21
- Pivot resistance is noted at 22.08, 22.28, 22.52
| Levels | Levels.1 |
|---|---|
| Previous Daily High | 22.04 |
| Previous Daily Low | 21.61 |
| Previous Weekly High | 22.62 |
| Previous Weekly Low | 21.84 |
| Previous Monthly High | 24.55 |
| Previous Monthly Low | 22.76 |
| Daily Fibonacci 38.2% | 21.77 |
| Daily Fibonacci 61.8% | 21.88 |
| Daily Pivot Point S1 | 21.65 |
| Daily Pivot Point S2 | 21.41 |
| Daily Pivot Point S3 | 21.21 |
| Daily Pivot Point R1 | 22.08 |
| Daily Pivot Point R2 | 22.28 |
| Daily Pivot Point R3 | 22.52 |
[/s2If]
Join Our Telegram Group
")


