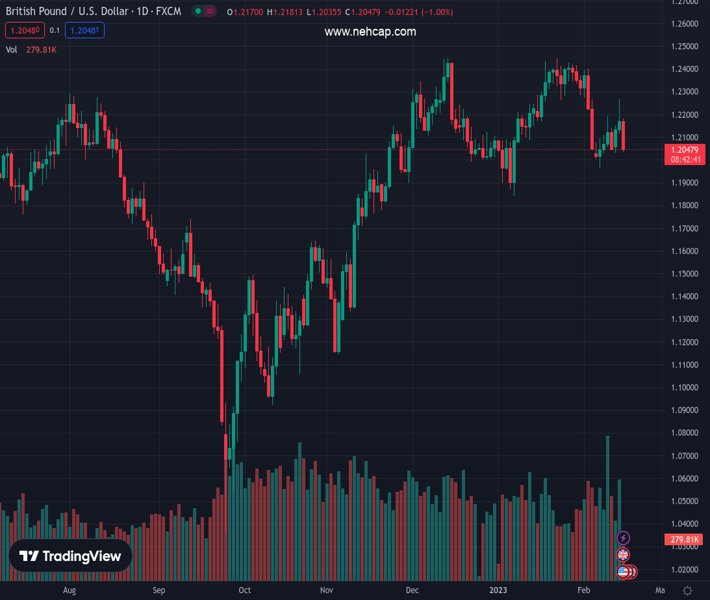
#GBPUSD @ 1.20451 dives back closer to the weekly low and is pressured by a combination of factors. (Pivot Orderbook analysis)
…
This is a premium post.
[s2If !current_user_can(access_s2member_level4)]Please register for PREMIUM VERSION HERE to read full post below containing analysis. In case of any error or you think you are not able to read the full post below, please email us at support#nehcap.com [lwa][/s2If] [s2If current_user_can(access_s2member_level4)]
- GBP/USD dives back closer to the weekly low and is pressured by a combination of factors.
- The softer-than-expected UK CPI print weighs on the pair amid broad-based USD strength.
- Bearish traders now look forward to the US economic data for some meaningful impetus.
The pair currently trades last at 1.20451.
The previous day high was 1.227 while the previous day low was 1.2118. The daily 38.2% Fib levels comes at 1.2212, expected to provide resistance. Similarly, the daily 61.8% fib level is at 1.2176, expected to provide resistance.
The GBP/USD pair comes under intense selling pressure on Wednesday and extends the previous day’s late pullback from over a one-week high. The downfall remains uninterrupted through the mid-European session and drags spot prices back closer to the weekly low, around the 1.2035 region in the last hour.
The British Pound weakens across the board in reaction to softer-than-expected UK consumer inflation figures. This comes on the back of a dovish assessment of the Bank of England’s policy decision and suggests that the current rate-hiking cycle might be nearing the end. Apart from this, a strong follow-through buying around the US Dollar contributes to the GBP/USD pair’s steep intraday decline of nearly 150 pips.
In fact, the USD Index, which tracks the Greenback against a basket of currencies, stands tall near a multi-week high amid expectations for further policy tightening by the Fed. The bets were lifted by the US CPI report and hawkish comments by several FOMC members on Tuesday. Adding to this, the prevalent risk-off mood – as depicted by a generally weaker tone around the equity markets – further underpins the safe-haven buck.
With the latest leg down, the GBP/USD pair reverses its weekly gains and seems poised to depreciate further. Some follow-through selling below the weekly low, around the 1.2030 area, will reaffirm the negative bias. This, in turn, should pave the way for a slide further below the 1.2000 psychological mark, towards challenging a technically significant 200-day SMA support, which is currently pegged near the 1.1935 region.
Next on tap is the US economic docket, highlighting the release of Retail Sales figures and the Empire State Manufacturing Index. Traders will further take cues from the broader risk sentiment, which will influence the USD price dynamics and provide a fresh impetus to the GBP/USD pair. Nevertheless, the aforementioned fundamental backdrop favours bearish trades and suggests that the path of least resistance for spot prices is to the downside.
Technical Levels: Supports and Resistances
GBPUSD currently trading at 1.2044 at the time of writing. Pair opened at 1.2177 and is trading with a change of -1.09 % .
| Overview | Overview.1 | |
|---|---|---|
| 0 | Today last price | 1.2044 |
| 1 | Today Daily Change | -0.0133 |
| 2 | Today Daily Change % | -1.0900 |
| 3 | Today daily open | 1.2177 |
The pair is trading below its 20 Daily moving average @ 1.2249, below its 50 Daily moving average @ 1.2186 , above its 100 Daily moving average @ 1.1874 and above its 200 Daily moving average @ 1.1943
| Trends | Trends.1 | |
|---|---|---|
| 0 | Daily SMA20 | 1.2249 |
| 1 | Daily SMA50 | 1.2186 |
| 2 | Daily SMA100 | 1.1874 |
| 3 | Daily SMA200 | 1.1943 |
The previous day high was 1.227 while the previous day low was 1.2118. The daily 38.2% Fib levels comes at 1.2212, expected to provide resistance. Similarly, the daily 61.8% fib level is at 1.2176, expected to provide resistance.
Note the levels of interest below:
- Pivot support is noted at 1.2107, 1.2036, 1.1954
- Pivot resistance is noted at 1.2259, 1.234, 1.2411
| Levels | Levels.1 |
|---|---|
| Previous Daily High | 1.2270 |
| Previous Daily Low | 1.2118 |
| Previous Weekly High | 1.2194 |
| Previous Weekly Low | 1.1961 |
| Previous Monthly High | 1.2448 |
| Previous Monthly Low | 1.1841 |
| Daily Fibonacci 38.2% | 1.2212 |
| Daily Fibonacci 61.8% | 1.2176 |
| Daily Pivot Point S1 | 1.2107 |
| Daily Pivot Point S2 | 1.2036 |
| Daily Pivot Point S3 | 1.1954 |
| Daily Pivot Point R1 | 1.2259 |
| Daily Pivot Point R2 | 1.2340 |
| Daily Pivot Point R3 | 1.2411 |
[/s2If]
Join Our Telegram Group
")


