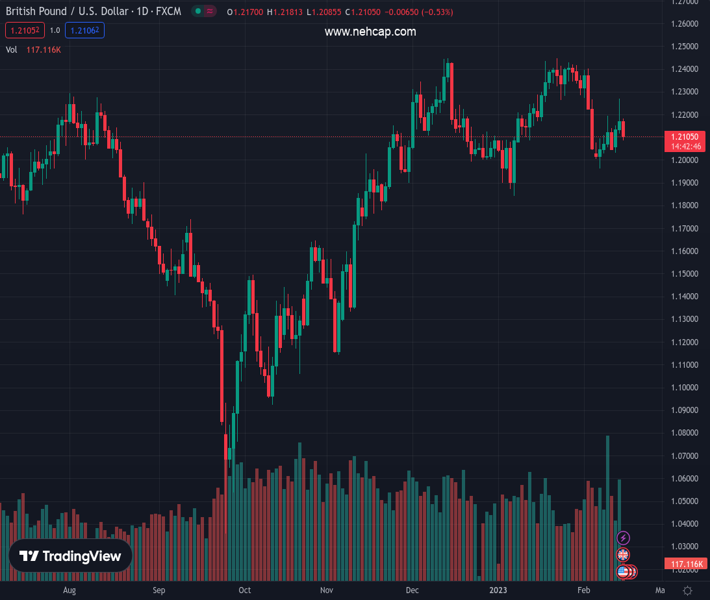
#GBPUSD @ 1.20973 extends the previous day’s pullback from fortnight high to snap two-day uptrend. (Pivot Orderbook analysis)
…
This is a premium post.
[s2If !current_user_can(access_s2member_level4)]Please register for PREMIUM VERSION HERE to read full post below containing analysis. In case of any error or you think you are not able to read the full post below, please email us at support#nehcap.com [lwa][/s2If] [s2If current_user_can(access_s2member_level4)]
- GBP/USD extends the previous day’s pullback from fortnight high to snap two-day uptrend.
- UK CPI slides to 10.1% YoY in January versus 10.3% expected and 10.5% prior.
- Upbeat Treasury bond yields, hawkish Fed speak underpin US Dollar rebound.
- Hopes of overcoming UK’s labor crisis, BoE’s cautious optimism probe Cable buyers.
The pair currently trades last at 1.20973.
The previous day high was 1.227 while the previous day low was 1.2118. The daily 38.2% Fib levels comes at 1.2212, expected to provide resistance. Similarly, the daily 61.8% fib level is at 1.2176, expected to provide resistance.
GBP/USD takes offers to refresh the intraday low near 1.2100, adding strength to the first daily loss in three during early Wednesday, as the UK inflation data disappoints.
That said, UK Consumer Price Index dropped to 10.1% YoY in January versus 10.3% market forecasts and 10.5% previous readings. With this, the headline inflation marks the third monthly decline after rising to the 41-year high in October. More importantly, the Core CPI, which excludes volatile food and energy items, slide to 5.8% on yearly basis compared to the 6.2% expected and 6.3% in previous readings.
Also read: Breaking: UK annualized CPI inflation softens to 10.1% in January vs.10.3% expected
Given the mostly downbeat UK inflation numbers, backed by the previous day’s mixed jobs report, the GBP/USD could witness further downside as the Bank of England (BoE) Officials have recently highlighted the data dependency for further rate hikes
Further, a separate survey of economists from Reuters signaled no more than one rate lift of 25 basis points (bps), in March, before the BoE initiates the policy pivot calls. The same could exert additional downside pressure on the GBP/USD prices, because the Fed policymakers are comparatively more hawkish despite the latest soft US inflation.
Alternatively, the Financial Times (FT) quoted officials familiar with the matter to mention that UK Prime Minister Rishi Sunak and Finance Minister Jeremy Hunt are up for a deal with workers including a lump sum payment by backdating next year’s pay award. The same joins the previous attempts of the UK firms to increase the labor pay to underpin the inflation woes and put a floor under the GBP/USD price.
However, hawkish Federal Reserve (Fed) comments and a recovery in the US Treasury bond yields, despite unimpressive US Consumer Price Index (CPI), seem to exert downside pressure on the Cable pair.
Against this backdrop, US 10-year Treasury bond yields remain intact at around 3.75%, after rising three basis points (bps) to refresh a six-week high the previous day whereas the two-year counterpart copies the moves near the highest level since early November 2022 by poking 4.62%, near 4.61% at the latest. That said, the S&P 500 Futures dropped half a percent while tracing Wall Street’s losses and favor the US Dollar’s haven demand, which in turn allowed the US Dollar Index (DXY) to print the first daily gains in three, up 0.27% intraday near 103.55 by the press time.
Having witnessed the initial market reaction to the key UK data, GBP/USD traders should wait for the US Retail Sales and Industrial Production details for January, as well as NY Empire State Manufacturing Index for February, for clear directions. That said, a few central bankers from the Fed and the BoE are also lined up for speeches and may entertain the Cable traders ahead of Friday’s UK Retail Sales.
GBP/USD pair’s U-turn from the 50-DMA, around 1.2185 by the press time, joins bearish MACD signals and the RSI retreat, to direct sellers towards the weekly support line surrounding 1.2060.
Technical Levels: Supports and Resistances
GBPUSD currently trading at 1.2139 at the time of writing. Pair opened at 1.2177 and is trading with a change of -0.31% % .
| Overview | Overview.1 | |
|---|---|---|
| 0 | Today last price | 1.2139 |
| 1 | Today Daily Change | -0.0038 |
| 2 | Today Daily Change % | -0.31% |
| 3 | Today daily open | 1.2177 |
The pair is trading below its 20 Daily moving average @ 1.2249, below its 50 Daily moving average @ 1.2186 , above its 100 Daily moving average @ 1.1874 and above its 200 Daily moving average @ 1.1943
| Trends | Trends.1 | |
|---|---|---|
| 0 | Daily SMA20 | 1.2249 |
| 1 | Daily SMA50 | 1.2186 |
| 2 | Daily SMA100 | 1.1874 |
| 3 | Daily SMA200 | 1.1943 |
The previous day high was 1.227 while the previous day low was 1.2118. The daily 38.2% Fib levels comes at 1.2212, expected to provide resistance. Similarly, the daily 61.8% fib level is at 1.2176, expected to provide resistance.
Note the levels of interest below:
- Pivot support is noted at 1.2107, 1.2036, 1.1954
- Pivot resistance is noted at 1.2259, 1.234, 1.2411
| Levels | Levels.1 |
|---|---|
| Previous Daily High | 1.2270 |
| Previous Daily Low | 1.2118 |
| Previous Weekly High | 1.2194 |
| Previous Weekly Low | 1.1961 |
| Previous Monthly High | 1.2448 |
| Previous Monthly Low | 1.1841 |
| Daily Fibonacci 38.2% | 1.2212 |
| Daily Fibonacci 61.8% | 1.2176 |
| Daily Pivot Point S1 | 1.2107 |
| Daily Pivot Point S2 | 1.2036 |
| Daily Pivot Point S3 | 1.1954 |
| Daily Pivot Point R1 | 1.2259 |
| Daily Pivot Point R2 | 1.2340 |
| Daily Pivot Point R3 | 1.2411 |
[/s2If]
Join Our Telegram Group
")


