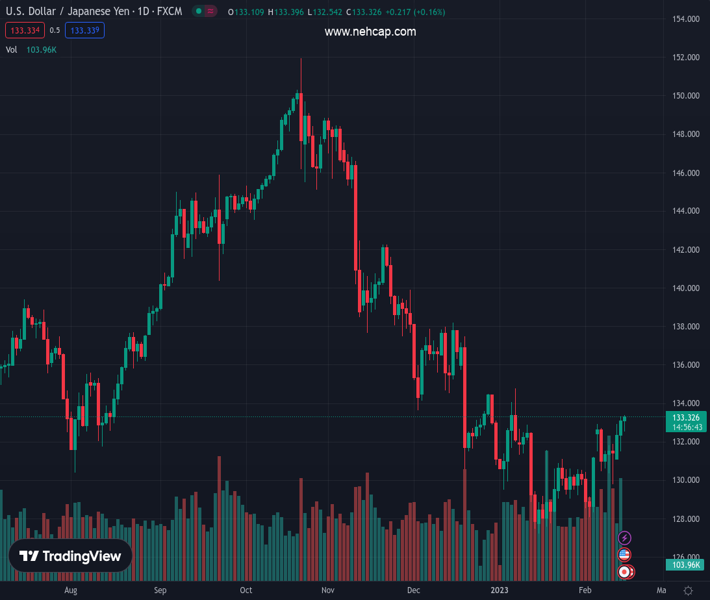
#USDJPY @ 133.315 retreats from intraday high, indecisive after two-day winning streak., @nehcap view: Limited upside expected (Pivot Orderbook analysis)
…
This is a premium post.
[s2If !current_user_can(access_s2member_level4)]Please register for PREMIUM VERSION HERE to read full post below containing analysis. In case of any error or you think you are not able to read the full post below, please email us at support#nehcap.com [lwa][/s2If] [s2If current_user_can(access_s2member_level4)]
- USD/JPY retreats from intraday high, indecisive after two-day winning streak.
- Sustained break of 50-DMA, upbeat oscillators favor bulls within bearish chart pattern.
- A clear downside break of 130.60 confirms rising wedge and can recall sellers.
The pair currently trades last at 133.315.
The previous day high was 133.32 while the previous day low was 131.5. The daily 38.2% Fib levels comes at 132.62, expected to provide support. Similarly, the daily 61.8% fib level is at 132.19, expected to provide support.
USD/JPY bulls take a breather during early Wednesday morning in Europe, after a two-day uptrend, as it eases to 133.00 by the press time. Even so, the Yen pair remains around a six-week high, marked the previous day.
USD/JPY buyers cheered the upside break of the 50-DMA, as well as bullish MACD signals and firmer RSI (14), to refresh the monthly high on Tuesday. However, the market’s lack of acceptance of the recent bullish bias seemed to have probed the quote’s further upside.
That said, the USD/JPY remains inside a one-month-old rising wedge bearish chart formation.
Hence, the DMA breakout joins upbeat oscillators to support the bulls but the upside room appears limited to the stated wedge’s top line, close to 133.60.
Even if the quote rises past 133.60, a two-month-old horizontal resistance region near 134.50-70, will precede the 200-DMA level surrounding 136.90 to challenge the USD/JPY bulls.
Meanwhile, pullback moves remain elusive unless staying beyond the 50-DMA level of 132.00.
Following that, a convergence of the 21-DMA and the aforementioned wedge’s lower line, close to 130.60, appears a tough nut to crack for the USD/JPY bears.
It should be noted that the 130.00 round figure will act as an extra filter towards the south of 130.60 before directing the USD/JPY sellers towards the theoretical target of the stated wedge, namely 125.50.
Trend: Limited upside expected
Technical Levels: Supports and Resistances
USDJPY currently trading at 133.04 at the time of writing. Pair opened at 133.04 and is trading with a change of 0.00% % .
| Overview | Overview.1 | |
|---|---|---|
| 0 | Today last price | 133.04 |
| 1 | Today Daily Change | 0.00 |
| 2 | Today Daily Change % | 0.00% |
| 3 | Today daily open | 133.04 |
The pair is trading above its 20 Daily moving average @ 130.51, above its 50 Daily moving average @ 132.1 , below its 100 Daily moving average @ 137.96 and below its 200 Daily moving average @ 136.85
| Trends | Trends.1 | |
|---|---|---|
| 0 | Daily SMA20 | 130.51 |
| 1 | Daily SMA50 | 132.10 |
| 2 | Daily SMA100 | 137.96 |
| 3 | Daily SMA200 | 136.85 |
The previous day high was 133.32 while the previous day low was 131.5. The daily 38.2% Fib levels comes at 132.62, expected to provide support. Similarly, the daily 61.8% fib level is at 132.19, expected to provide support.
Note the levels of interest below:
- Pivot support is noted at 131.92, 130.8, 130.11
- Pivot resistance is noted at 133.74, 134.43, 135.55
| Levels | Levels.1 |
|---|---|
| Previous Daily High | 133.32 |
| Previous Daily Low | 131.50 |
| Previous Weekly High | 132.91 |
| Previous Weekly Low | 129.81 |
| Previous Monthly High | 134.78 |
| Previous Monthly Low | 127.22 |
| Daily Fibonacci 38.2% | 132.62 |
| Daily Fibonacci 61.8% | 132.19 |
| Daily Pivot Point S1 | 131.92 |
| Daily Pivot Point S2 | 130.80 |
| Daily Pivot Point S3 | 130.11 |
| Daily Pivot Point R1 | 133.74 |
| Daily Pivot Point R2 | 134.43 |
| Daily Pivot Point R3 | 135.55 |
[/s2If]
Join Our Telegram Group
")


