#XAGUSD @ 21.738 Silver prints three-day losing streak as sellers flirt with 2.5-month low., @nehcap view: Further downside expected (Pivot Orderbook analysis)
…
This is a premium post.
[s2If !current_user_can(access_s2member_level4)]Please register for PREMIUM VERSION HERE to read full post below containing analysis. In case of any error or you think you are not able to read the full post below, please email us at support#nehcap.com [lwa][/s2If] [s2If current_user_can(access_s2member_level4)]
- Silver prints three-day losing streak as sellers flirt with 2.5-month low.
- Clear downside break of 100-DMA, bearish MACD signals favor sellers.
- 50% Fibonacci retracement, 200-DMA challenge further downside.
- Recovery remains elusive unless crossing $23.15, ascending trend line from early September 2022 adds to the downside filters.
The pair currently trades last at 21.738.
The previous day high was 22.04 while the previous day low was 21.61. The daily 38.2% Fib levels comes at 21.77, expected to provide resistance. Similarly, the daily 61.8% fib level is at 21.88, expected to provide resistance.
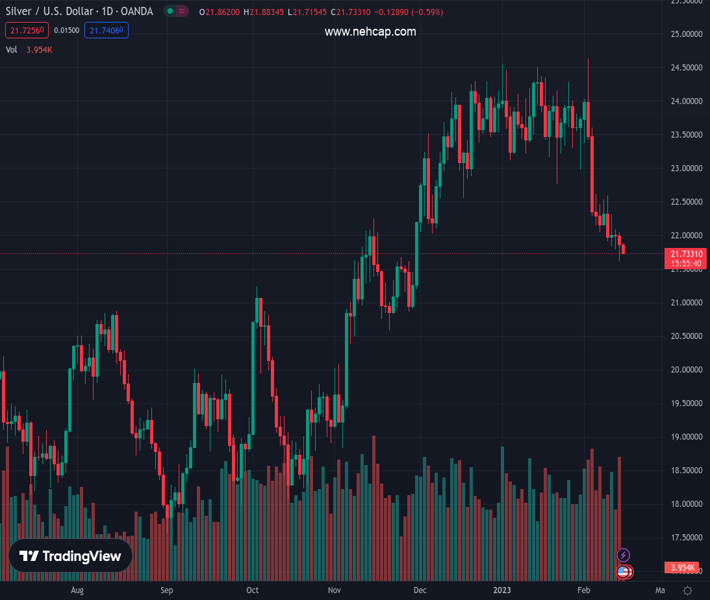
Silver price (XAG/USD) remains on the bear’s radar as the bright metal renews intraday low near $21.70 during early Wednesday in Europe. In doing so, the bullion stays pressured around the lowest levels since November 30 amid a three-day downtrend.
The quote’s weakness could be linked to the daily closing below the 100-DMA, as well as sustained trading below the previous support line from early December 2022, respectively near $21.95 and $23.15.
As a result, the XAG/USD bears have a free hand while expecting further downside of the metal.
However, the 50% Fibonacci retracement of September 2022 to February 2023 upside, near $21.10, precedes the 200-DMA level of $21.00 to offer a strong challenge to the Silver sellers.
Following that, the 61.8% Fibonacci retracement surrounding $20.30, also known as the golden Fibonacci ratio, as well as a 5.5-month-old ascending support line, close to $20.00 round figure, will become the key for the XAG/USD sellers to watch.
Alternatively, recovery moves need to stay beyond the 100-DMA hurdle of $21.95, as well as the $22.00 round figure to convince intraday buyers of the Silver.
Even so, the previous weekly high near $22.60 and the support-turned-resistance line from December 06, 2022, close to $23.15, could challenge the XAG/USD bulls before giving them control.
Trend: Further downside expected
Technical Levels: Supports and Resistances
XAGUSD currently trading at 21.73 at the time of writing. Pair opened at 21.88 and is trading with a change of -0.69% % .
| Overview | Overview.1 | |
|---|---|---|
| 0 | Today last price | 21.73 |
| 1 | Today Daily Change | -0.15 |
| 2 | Today Daily Change % | -0.69% |
| 3 | Today daily open | 21.88 |
The pair is trading below its 20 Daily moving average @ 23.07, below its 50 Daily moving average @ 23.42 , below its 100 Daily moving average @ 21.9 and above its 200 Daily moving average @ 21.01
| Trends | Trends.1 | |
|---|---|---|
| 0 | Daily SMA20 | 23.07 |
| 1 | Daily SMA50 | 23.42 |
| 2 | Daily SMA100 | 21.90 |
| 3 | Daily SMA200 | 21.01 |
The previous day high was 22.04 while the previous day low was 21.61. The daily 38.2% Fib levels comes at 21.77, expected to provide resistance. Similarly, the daily 61.8% fib level is at 21.88, expected to provide resistance.
Note the levels of interest below:
- Pivot support is noted at 21.65, 21.41, 21.21
- Pivot resistance is noted at 22.08, 22.28, 22.52
| Levels | Levels.1 |
|---|---|
| Previous Daily High | 22.04 |
| Previous Daily Low | 21.61 |
| Previous Weekly High | 22.62 |
| Previous Weekly Low | 21.84 |
| Previous Monthly High | 24.55 |
| Previous Monthly Low | 22.76 |
| Daily Fibonacci 38.2% | 21.77 |
| Daily Fibonacci 61.8% | 21.88 |
| Daily Pivot Point S1 | 21.65 |
| Daily Pivot Point S2 | 21.41 |
| Daily Pivot Point S3 | 21.21 |
| Daily Pivot Point R1 | 22.08 |
| Daily Pivot Point R2 | 22.28 |
| Daily Pivot Point R3 | 22.52 |
[/s2If]
Join Our Telegram Group
")


