#EURUSD @ 1.07409 treads water after probing two-day uptrend, sidelined of late., @nehcap view: Limited recovery expected (Pivot Orderbook analysis)
…
This is a premium post.
[s2If !current_user_can(access_s2member_level4)]Please register for PREMIUM VERSION HERE to read full post below containing analysis. In case of any error or you think you are not able to read the full post below, please email us at support#nehcap.com [lwa][/s2If] [s2If current_user_can(access_s2member_level4)]
- EUR/USD treads water after probing two-day uptrend, sidelined of late.
- Megaphone chart formation, steady RSI (14) favors continuation of sideways performance.
- 200-SMA adds to the upside filters within one-week-old megaphone trend-widening pattern.
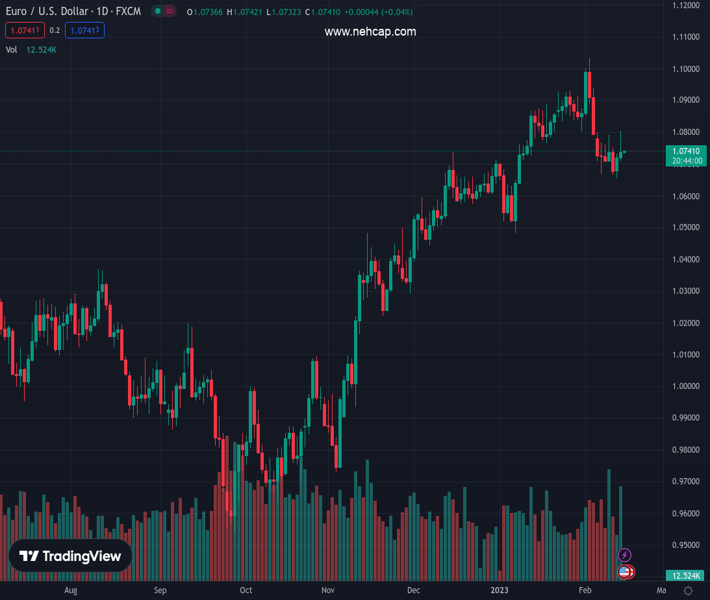
The pair currently trades last at 1.07409.
The previous day high was 1.0805 while the previous day low was 1.0707. The daily 38.2% Fib levels comes at 1.0767, expected to provide resistance. Similarly, the daily 61.8% fib level is at 1.0744, expected to provide resistance.
EUR/USD remains mostly steady around 1.0740 as traders await more clues to defend late Tuesday’s bearish bias amid Wednesday’s sluggish hours.
The major currency pair bounced off 1.0706 the previous day before reversing from the weekly high surrounding 1.0800. In doing so, the quote remained inside a one-week-long megaphone chart formation, a trend-widening pattern.
In addition to the megaphone chart formation, the steady line of the RSI (14) and bullish MACD signals also favor the odds of the EUR/USD pair’s further sideways grind, with an expanding range.
That said, the 50% Fibonacci retracement level of the pair’s January-February moves and the 200-Simple Moving Average (SMA), respectively near 1.0760 and 1.0780, restrict the short-term upside of the EUR/USD pair.
Following that, the stated megaphone’s top line, close to 1.0810 by the press time, will be crucial to watch for the pair buyers.
On the contrary, a downside break of the 61.8% Fibonacci retracement, also known as the golden ratio, near 1.0690, becomes necessary for the EUR/USD bear’s conviction. Even so, the lower line of the aforementioned trend-widening pattern, close to 1.0655, could challenge the quote’s downside.
In a case where EUR/USD remains bearish past 1.0655, the odds of witnessing a gradual south toward the previous monthly low near 1.0480 can’t be ruled out.
Trend: Limited recovery expected
Technical Levels: Supports and Resistances
EURUSD currently trading at 1.0738 at the time of writing. Pair opened at 1.0738 and is trading with a change of 0.00% % .
| Overview | Overview.1 | |
|---|---|---|
| 0 | Today last price | 1.0738 |
| 1 | Today Daily Change | 0.0000 |
| 2 | Today Daily Change % | 0.00% |
| 3 | Today daily open | 1.0738 |
The pair is trading below its 20 Daily moving average @ 1.0818, above its 50 Daily moving average @ 1.0716 , above its 100 Daily moving average @ 1.0385 and above its 200 Daily moving average @ 1.0325
| Trends | Trends.1 | |
|---|---|---|
| 0 | Daily SMA20 | 1.0818 |
| 1 | Daily SMA50 | 1.0716 |
| 2 | Daily SMA100 | 1.0385 |
| 3 | Daily SMA200 | 1.0325 |
The previous day high was 1.0805 while the previous day low was 1.0707. The daily 38.2% Fib levels comes at 1.0767, expected to provide resistance. Similarly, the daily 61.8% fib level is at 1.0744, expected to provide resistance.
Note the levels of interest below:
- Pivot support is noted at 1.0695, 1.0652, 1.0597
- Pivot resistance is noted at 1.0793, 1.0848, 1.0891
| Levels | Levels.1 |
|---|---|
| Previous Daily High | 1.0805 |
| Previous Daily Low | 1.0707 |
| Previous Weekly High | 1.0799 |
| Previous Weekly Low | 1.0666 |
| Previous Monthly High | 1.0930 |
| Previous Monthly Low | 1.0483 |
| Daily Fibonacci 38.2% | 1.0767 |
| Daily Fibonacci 61.8% | 1.0744 |
| Daily Pivot Point S1 | 1.0695 |
| Daily Pivot Point S2 | 1.0652 |
| Daily Pivot Point S3 | 1.0597 |
| Daily Pivot Point R1 | 1.0793 |
| Daily Pivot Point R2 | 1.0848 |
| Daily Pivot Point R3 | 1.0891 |
[/s2If]
Join Our Telegram Group
")


