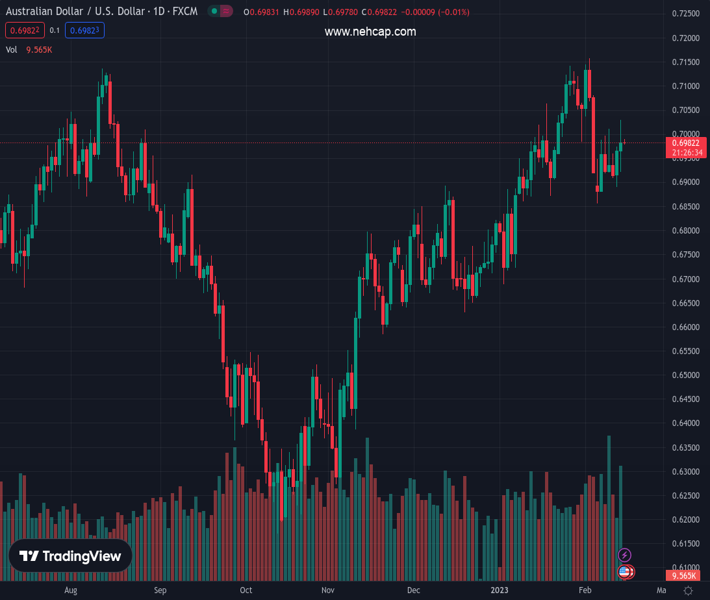
#AUDUSD @ 0.69833 remains depressed at intraday low, snaps two-day winning streak. (Pivot Orderbook analysis)
…
This is a premium post.
[s2If !current_user_can(access_s2member_level4)]Please register for PREMIUM VERSION HERE to read full post below containing analysis. In case of any error or you think you are not able to read the full post below, please email us at support#nehcap.com [lwa][/s2If] [s2If current_user_can(access_s2member_level4)]
- AUD/USD remains depressed at intraday low, snaps two-day winning streak.
- RBA Governor Lowe’s Testimony before Senate Economics Legislation Committee appears less hawkish.
- Fed policymakers defend rate hike bias despite unimpressive US inflation.
- US data, risk catalysts eyed for intermediate directions ahead of Thursday’s Aussie jobs report.
The pair currently trades last at 0.69833.
The previous day high was 0.703 while the previous day low was 0.6922. The daily 38.2% Fib levels comes at 0.6988, expected to provide resistance. Similarly, the daily 61.8% fib level is at 0.6963, expected to provide support.
AUD/USD holds lower ground near 0.6980 after Reserve Bank of Australia (RBA) Governor Philip Lowe’s Testimony during the mid-Asian session on Wednesday. In doing so, the Aussie pair appears to give more weight to the hawkish Fed signals and the market’s offbeat mood ahead of the key data/events from the US and Australia.
In his testimony before the Senate Economics Legislation Committee, RBA Governor Lowe said, “Inflation is way too high,” and that it needs to come down. The policymaker, however, also stated that the government fiscal policy is broadly neutral, which in turn suggests the need for other efforts to tame inflation than the rate hikes. The same seemed to have favored the Aussie bears in keeping the reins around the daily low.
Also read: RBA Lowe: Inflation is way too high, needs to come down
It should be noted that Lowe’s comments weren’t as impressive as the Federal Reserve (Fed) officials’ defense to the higher rates, despite the softer US Consumer Price Index (CPI). As a result, the AUD/USD pair returns to the bear’s radar after a two-day absence.
That said, most of the Federal Reserve (Fed) policymakers were in favor of further rate hikes even as the United States inflation failed to match “positive surprise” hopes. The same propelled the US Treasury bond yields and US Dollar.
US 10-year Treasury bond yields seesaw around 3.75%, up three basis points (bps) after refreshing a six-week high whereas the two-year counterpart jumped to the highest level since early November 2022 by poking 4.62%. The same joined day-end losses of Wall Street, as well as mildly offered S&P 500 Futures, to underpin the US Dollar Index (DXY) rebound.
Given the risk-off mood and the firmer US Treasury bond yields, as well as the hawkish Fed bets, the AUD/USD bears are likely to remain in the driver’s seat. However, today’s US Retail Sales and Industrial Production details for January, as well as NY Empire State Manufacturing Index for February, should be watched for intraday clues. Above all, Thursday’s Aussie employment data eyed for clear directions.
A clear downside break of the 50-DMA support, around 0.6885 at the latest, becomes necessary for the AUD/USD bears to keep the reins.
Technical Levels: Supports and Resistances
AUDUSD currently trading at 0.698 at the time of writing. Pair opened at 0.6992 and is trading with a change of -0.17% % .
| Overview | Overview.1 | |
|---|---|---|
| 0 | Today last price | 0.698 |
| 1 | Today Daily Change | -0.0012 |
| 2 | Today Daily Change % | -0.17% |
| 3 | Today daily open | 0.6992 |
The pair is trading below its 20 Daily moving average @ 0.7002, above its 50 Daily moving average @ 0.688 , above its 100 Daily moving average @ 0.6695 and above its 200 Daily moving average @ 0.6806
| Trends | Trends.1 | |
|---|---|---|
| 0 | Daily SMA20 | 0.7002 |
| 1 | Daily SMA50 | 0.6880 |
| 2 | Daily SMA100 | 0.6695 |
| 3 | Daily SMA200 | 0.6806 |
The previous day high was 0.703 while the previous day low was 0.6922. The daily 38.2% Fib levels comes at 0.6988, expected to provide resistance. Similarly, the daily 61.8% fib level is at 0.6963, expected to provide support.
Note the levels of interest below:
- Pivot support is noted at 0.6932, 0.6873, 0.6824
- Pivot resistance is noted at 0.7041, 0.7089, 0.7149
| Levels | Levels.1 |
|---|---|
| Previous Daily High | 0.7030 |
| Previous Daily Low | 0.6922 |
| Previous Weekly High | 0.7011 |
| Previous Weekly Low | 0.6856 |
| Previous Monthly High | 0.7143 |
| Previous Monthly Low | 0.6688 |
| Daily Fibonacci 38.2% | 0.6988 |
| Daily Fibonacci 61.8% | 0.6963 |
| Daily Pivot Point S1 | 0.6932 |
| Daily Pivot Point S2 | 0.6873 |
| Daily Pivot Point S3 | 0.6824 |
| Daily Pivot Point R1 | 0.7041 |
| Daily Pivot Point R2 | 0.7089 |
| Daily Pivot Point R3 | 0.7149 |
[/s2If]
Join Our Telegram Group
")


