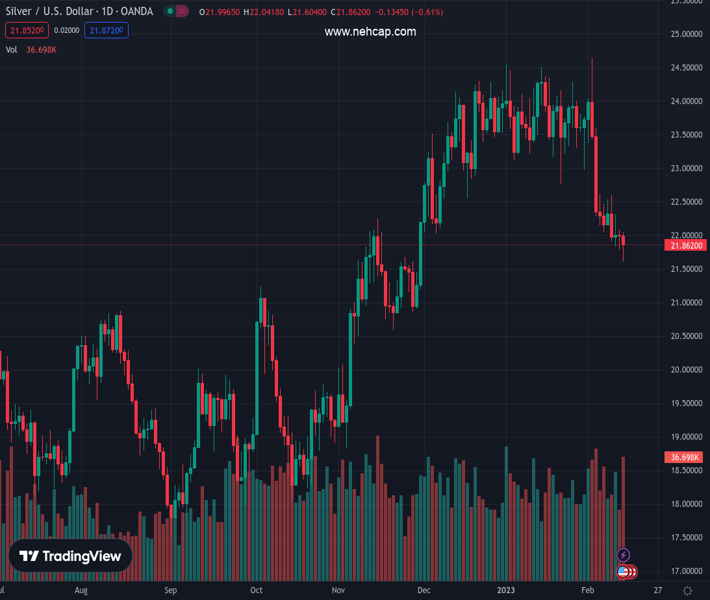
#XAGUSD @ 21.860 Silver price stumbles below the 200-day EMA at $21.95, shifting its bias to neutral-downwards. (Pivot Orderbook analysis)
…
This is a premium post.
[s2If !current_user_can(access_s2member_level4)]Please register for PREMIUM VERSION HERE to read full post below containing analysis. In case of any error or you think you are not able to read the full post below, please email us at support#nehcap.com [lwa][/s2If] [s2If current_user_can(access_s2member_level4)]
- Silver price stumbles below the 200-day EMA at $21.95, shifting its bias to neutral-downwards.
- XAG/USD Price Analysis: Shifted neutral-to-downwards, though two more closes below the 200-DMA would cement its downward bias.
The pair currently trades last at 21.860.
The previous day high was 22.08 while the previous day low was 21.79. The daily 38.2% Fib levels comes at 21.9, expected to provide resistance. Similarly, the daily 61.8% fib level is at 21.97, expected to provide resistance.
Silver price continues to trade beneath the bottom-trendline of a megaphone formation and below the 200-day Exponential Moving Average (EMA) at 21.95, a bearish signal for the white metal. It should be said that a daily close below the latter would pave the way for further downside. At the time of writing, XAG/USD exchanges hands at $21.84 a troy ounce after hitting a daily high of $22.03.
After dropping below the bottom-trendline of a megaphone formation, the XAG/USD has failed to regain the $22.50 mark and exposed the 200-day EMA. A daily close is needed to further cement a change on the neutral bias to neutral-downwards, and it will expose untested support areas since December of 2022.
If that scenario plays out, the XAG/USD first support would be the November 28 daily low of $20.87, followed by the November 21 swing low of $20.59. Once cleared, the psychological level of $20.00 would be up for grabs.
In an alternate scenario, the XAG/USD first resistance would be the 200-day EMA at $21.94, ahead of the $22.00 figure. Once broken, Silver could aim inside the megaphone formation, but firstly it needs to crack the bottom trendline at $22.20.
It should be said that oscillators like the Relative Strength Index (RSI) suggest a bearish continuation, but the Rate of Change (RoC), confirms that sellers are losing momentum. Hence, the XAG/USD might consolidate around the $21.60-$22.00 area, awaiting a fresh catalyst before determining its direction.
Technical Levels: Supports and Resistances
XAGUSD currently trading at 21.85 at the time of writing. Pair opened at 21.97 and is trading with a change of -0.55 % .
| Overview | Overview.1 | |
|---|---|---|
| 0 | Today last price | 21.85 |
| 1 | Today Daily Change | -0.12 |
| 2 | Today Daily Change % | -0.55 |
| 3 | Today daily open | 21.97 |
The pair is trading below its 20 Daily moving average @ 23.17, below its 50 Daily moving average @ 23.43 , below its 100 Daily moving average @ 21.86 and above its 200 Daily moving average @ 21.0
| Trends | Trends.1 | |
|---|---|---|
| 0 | Daily SMA20 | 23.17 |
| 1 | Daily SMA50 | 23.43 |
| 2 | Daily SMA100 | 21.86 |
| 3 | Daily SMA200 | 21.00 |
The previous day high was 22.08 while the previous day low was 21.79. The daily 38.2% Fib levels comes at 21.9, expected to provide resistance. Similarly, the daily 61.8% fib level is at 21.97, expected to provide resistance.
Note the levels of interest below:
- Pivot support is noted at 21.82, 21.66, 21.53
- Pivot resistance is noted at 22.11, 22.24, 22.4
| Levels | Levels.1 |
|---|---|
| Previous Daily High | 22.08 |
| Previous Daily Low | 21.79 |
| Previous Weekly High | 22.62 |
| Previous Weekly Low | 21.84 |
| Previous Monthly High | 24.55 |
| Previous Monthly Low | 22.76 |
| Daily Fibonacci 38.2% | 21.90 |
| Daily Fibonacci 61.8% | 21.97 |
| Daily Pivot Point S1 | 21.82 |
| Daily Pivot Point S2 | 21.66 |
| Daily Pivot Point S3 | 21.53 |
| Daily Pivot Point R1 | 22.11 |
| Daily Pivot Point R2 | 22.24 |
| Daily Pivot Point R3 | 22.40 |
[/s2If]
Join Our Telegram Group
")


