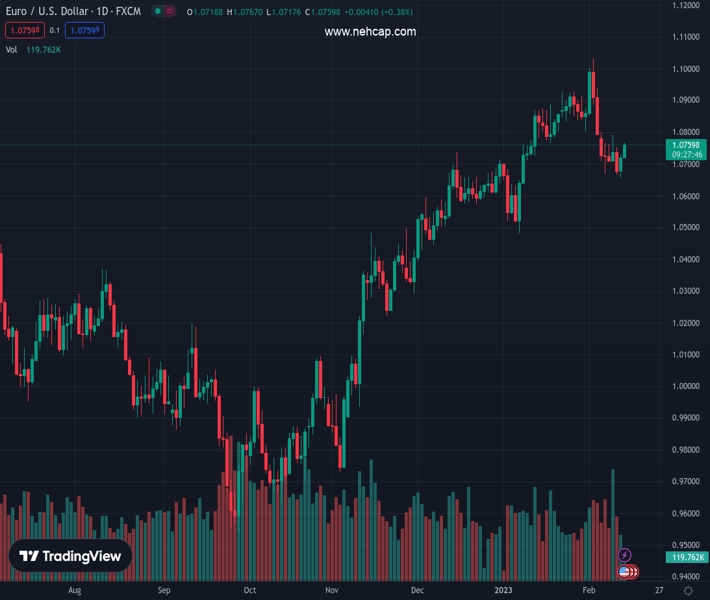
#EURUSD @ 1.07592 extends the weekly rebound well past the 1.0700 mark. (Pivot Orderbook analysis)
…
This is a premium post.
[s2If !current_user_can(access_s2member_level4)]Please register for PREMIUM VERSION HERE to read full post below containing analysis. In case of any error or you think you are not able to read the full post below, please email us at support#nehcap.com [lwa][/s2If] [s2If current_user_can(access_s2member_level4)]
- EUR/USD extends the weekly rebound well past the 1.0700 mark.
- The next hurdle of note aligns at the 3-month line near 108.30.
The pair currently trades last at 1.07592.
The previous day high was 1.073 while the previous day low was 1.0656. The daily 38.2% Fib levels comes at 1.0702, expected to provide support. Similarly, the daily 61.8% fib level is at 1.0684, expected to provide support.
The upside bias in EUR/USD manages to gather extra impulse following the breakout of the key barrier at 1.0700 on Tuesday.
Further upside is initially focused on 1.0790 (daily high February 9), while the surpass of this level should motivate the pair to confront the 3-month resistance line in the 108.30 region. Beyond the latter, there are no hurdles of note until the 2023 peak at 1.1032 (February 2).
In the longer run, the constructive view remains unchanged while above the 200-day SMA, today at 1.0323.
Technical Levels: Supports and Resistances
EURUSD currently trading at 1.075 at the time of writing. Pair opened at 1.0723 and is trading with a change of 0.25 % .
| Overview | Overview.1 | |
|---|---|---|
| 0 | Today last price | 1.0750 |
| 1 | Today Daily Change | 50.0000 |
| 2 | Today Daily Change % | 0.2500 |
| 3 | Today daily open | 1.0723 |
The pair is trading below its 20 Daily moving average @ 1.082, above its 50 Daily moving average @ 1.0711 , above its 100 Daily moving average @ 1.0374 and above its 200 Daily moving average @ 1.0324
| Trends | Trends.1 | |
|---|---|---|
| 0 | Daily SMA20 | 1.0820 |
| 1 | Daily SMA50 | 1.0711 |
| 2 | Daily SMA100 | 1.0374 |
| 3 | Daily SMA200 | 1.0324 |
The previous day high was 1.073 while the previous day low was 1.0656. The daily 38.2% Fib levels comes at 1.0702, expected to provide support. Similarly, the daily 61.8% fib level is at 1.0684, expected to provide support.
Note the levels of interest below:
- Pivot support is noted at 1.0676, 1.0628, 1.0601
- Pivot resistance is noted at 1.075, 1.0777, 1.0825
| Levels | Levels.1 |
|---|---|
| Previous Daily High | 1.0730 |
| Previous Daily Low | 1.0656 |
| Previous Weekly High | 1.0799 |
| Previous Weekly Low | 1.0666 |
| Previous Monthly High | 1.0930 |
| Previous Monthly Low | 1.0483 |
| Daily Fibonacci 38.2% | 1.0702 |
| Daily Fibonacci 61.8% | 1.0684 |
| Daily Pivot Point S1 | 1.0676 |
| Daily Pivot Point S2 | 1.0628 |
| Daily Pivot Point S3 | 1.0601 |
| Daily Pivot Point R1 | 1.0750 |
| Daily Pivot Point R2 | 1.0777 |
| Daily Pivot Point R3 | 1.0825 |
[/s2If]
Join Our Telegram Group
")


