The index remains on the defensive in the first half of the week. (Pivot Orderbook analysis)
…
This is a premium post.
[s2If !current_user_can(access_s2member_level4)]Please register for PREMIUM VERSION HERE to read full post below containing analysis. In case of any error or you think you are not able to read the full post below, please email us at support#nehcap.com [lwa][/s2If] [s2If current_user_can(access_s2member_level4)]
- The index remains on the defensive in the first half of the week.
- Next on the downside emerges the 102.60 zone.
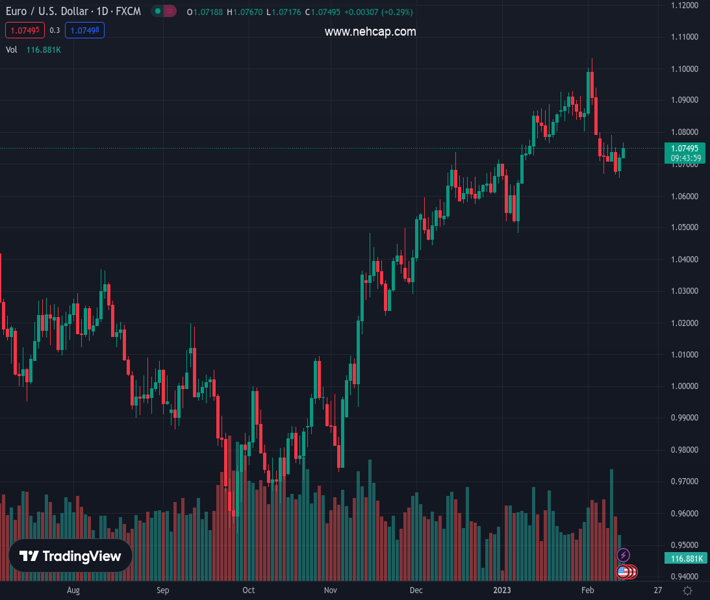
The pair currently trades last at 103.01.
The previous day high was 103.83 while the previous day low was 103.24. The daily 38.2% Fib levels comes at 103.47, expected to provide resistance. Similarly, the daily 61.8% fib level is at 103.61, expected to provide resistance.
DXY adds to the bearish note recorded on Monday and puts the 103.00 support level to the test on Tuesday.
The recent price action leaves the door open to the continuation of the consolidative phase for the time being. However, a drop below last week’s low at 102.64 (February 9) should open the door to a deeper pullback in the short term to, initially, the 3-month support line, today near 102.35.
In the longer run, while below the 200-day SMA at 106.45, the outlook for the index remains negative.
Technical Levels: Supports and Resistances
EURUSD currently trading at 103.01 at the time of writing. Pair opened at 103.28 and is trading with a change of -0.26 % .
| Overview | Overview.1 | |
|---|---|---|
| 0 | Today last price | 103.01 |
| 1 | Today Daily Change | 35.00 |
| 2 | Today Daily Change % | -0.26 |
| 3 | Today daily open | 103.28 |
The pair is trading above its 20 Daily moving average @ 102.45, below its 50 Daily moving average @ 103.42 , below its 100 Daily moving average @ 105.97 and below its 200 Daily moving average @ 106.73
| Trends | Trends.1 | |
|---|---|---|
| 0 | Daily SMA20 | 102.45 |
| 1 | Daily SMA50 | 103.42 |
| 2 | Daily SMA100 | 105.97 |
| 3 | Daily SMA200 | 106.73 |
The previous day high was 103.83 while the previous day low was 103.24. The daily 38.2% Fib levels comes at 103.47, expected to provide resistance. Similarly, the daily 61.8% fib level is at 103.61, expected to provide resistance.
Note the levels of interest below:
- Pivot support is noted at 103.06, 102.85, 102.47
- Pivot resistance is noted at 103.66, 104.05, 104.26
| Levels | Levels.1 |
|---|---|
| Previous Daily High | 103.83 |
| Previous Daily Low | 103.24 |
| Previous Weekly High | 103.96 |
| Previous Weekly Low | 102.64 |
| Previous Monthly High | 105.63 |
| Previous Monthly Low | 101.50 |
| Daily Fibonacci 38.2% | 103.47 |
| Daily Fibonacci 61.8% | 103.61 |
| Daily Pivot Point S1 | 103.06 |
| Daily Pivot Point S2 | 102.85 |
| Daily Pivot Point S3 | 102.47 |
| Daily Pivot Point R1 | 103.66 |
| Daily Pivot Point R2 | 104.05 |
| Daily Pivot Point R3 | 104.26 |
[/s2If]
Join Our Telegram Group
")


