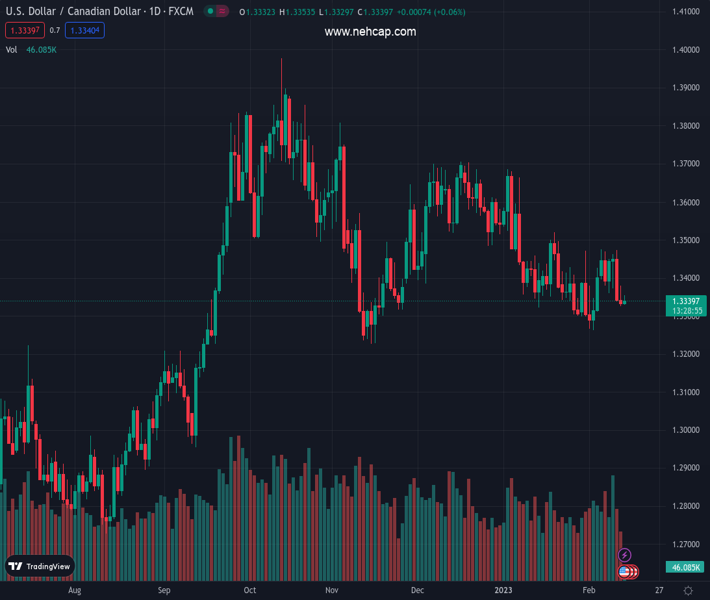
#USDCAD @ 1.33440 gains some positive traction on Tuesday, though lacks bullish conviction. (Pivot Orderbook analysis)
…
This is a premium post.
[s2If !current_user_can(access_s2member_level4)]Please register for PREMIUM VERSION HERE to read full post below containing analysis. In case of any error or you think you are not able to read the full post below, please email us at support#nehcap.com [lwa][/s2If] [s2If current_user_can(access_s2member_level4)]
- USD/CAD gains some positive traction on Tuesday, though lacks bullish conviction.
- Subdued crude oil prices undermine the Loonie and act as a tailwind for the pair.
- The ongoing USD retracement slide from a multi-month top caps any further gains.
- Traders also seem reluctant and prefer to wait for the release of the US CPI report.
The pair currently trades last at 1.33440.
The previous day high was 1.338 while the previous day low was 1.3325. The daily 38.2% Fib levels comes at 1.3346, expected to provide resistance. Similarly, the daily 61.8% fib level is at 1.3359, expected to provide resistance.
The USD/CAD pair attracts some buyers near the 1.3330 area on Tuesday and sticks to its modest intraday gains through the early part of the European session. The pair is currently placed near the daily top, around mid-1.3300s and for now, seems to have snapped a two-day losing streak to over a one-week low touched on Monday.
Subdued action around crude oil prices undermines the commodity-linked Loonie, which, in turn, is seen acting as a tailwind for the USD/CAD pair. The Biden Administration announced on Monday that it will sell 26 million barrels of crude from the Strategic Petroleum Reserve as part of a release mandated by Congress. This comes in the wake of worries about weakening demand, amid pressure on economic activity from higher interest rates and inflation, and weighs on the black liquid.
The upside for the USD/CAD pair, however, remains capped amid the ongoing US Dollar retracement slide from a multi-week high touched the previous day. A further decline in the US Treasury bond yields seems to be the only factor exerting downward pressure on the Greenback. That said, expectations that the Fed will stick to its hawkish stance for longer should limit the downside for the US bond yields. Adding to this, recession fears should limit losses for the safe-haven buck.
Traders might also refrain from placing aggressive USD bearish bets amid the risk of a stronger US CPI print for January. The speculations were reaffirmed by the Labor Department’s annual revisions of CPI data released on Friday, which showed that monthly consumer prices rose in December instead of falling as previously estimated. Moreover, the University of Michigan survey’s one-year inflation expectations climbed to 4.2% for the current month from 3.9% in January.
Hence, the market focus will remain glued to the latest US consumer inflation figures, due for release later during the early North American session. The crucial US CPI report will play a key role in influencing the Fed’s rate-hike path, which, in turn, should drive the USD demand. This, along with oil price dynamics, should provide some impetus to the USD/CAD pair and allow traders to grab short-term opportunities.
Technical Levels: Supports and Resistances
USDCAD currently trading at 1.3344 at the time of writing. Pair opened at 1.3336 and is trading with a change of 0.06 % .
| Overview | Overview.1 | |
|---|---|---|
| 0 | Today last price | 1.3344 |
| 1 | Today Daily Change | 0.0008 |
| 2 | Today Daily Change % | 0.0600 |
| 3 | Today daily open | 1.3336 |
The pair is trading below its 20 Daily moving average @ 1.3382, below its 50 Daily moving average @ 1.3487 , below its 100 Daily moving average @ 1.3529 and above its 200 Daily moving average @ 1.3238
| Trends | Trends.1 | |
|---|---|---|
| 0 | Daily SMA20 | 1.3382 |
| 1 | Daily SMA50 | 1.3487 |
| 2 | Daily SMA100 | 1.3529 |
| 3 | Daily SMA200 | 1.3238 |
The previous day high was 1.338 while the previous day low was 1.3325. The daily 38.2% Fib levels comes at 1.3346, expected to provide resistance. Similarly, the daily 61.8% fib level is at 1.3359, expected to provide resistance.
Note the levels of interest below:
- Pivot support is noted at 1.3314, 1.3292, 1.3259
- Pivot resistance is noted at 1.3369, 1.3402, 1.3424
| Levels | Levels.1 |
|---|---|
| Previous Daily High | 1.3380 |
| Previous Daily Low | 1.3325 |
| Previous Weekly High | 1.3476 |
| Previous Weekly Low | 1.3338 |
| Previous Monthly High | 1.3685 |
| Previous Monthly Low | 1.3300 |
| Daily Fibonacci 38.2% | 1.3346 |
| Daily Fibonacci 61.8% | 1.3359 |
| Daily Pivot Point S1 | 1.3314 |
| Daily Pivot Point S2 | 1.3292 |
| Daily Pivot Point S3 | 1.3259 |
| Daily Pivot Point R1 | 1.3369 |
| Daily Pivot Point R2 | 1.3402 |
| Daily Pivot Point R3 | 1.3424 |
[/s2If]
Join Our Telegram Group
")


