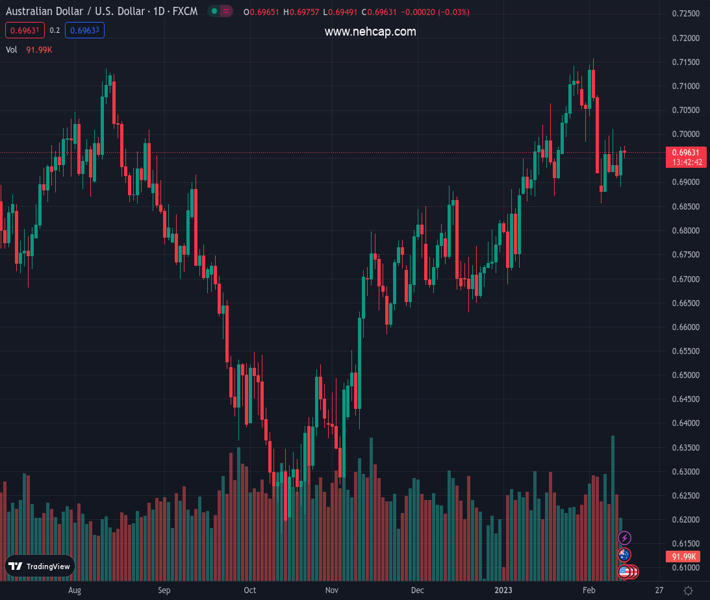
#AUDUSD @ 0.69656 lacks any firm intraday direction and oscillates in a narrow range on Tuesday. (Pivot Orderbook analysis)
…
This is a premium post.
[s2If !current_user_can(access_s2member_level4)]Please register for PREMIUM VERSION HERE to read full post below containing analysis. In case of any error or you think you are not able to read the full post below, please email us at support#nehcap.com [lwa][/s2If] [s2If current_user_can(access_s2member_level4)]
- AUD/USD lacks any firm intraday direction and oscillates in a narrow range on Tuesday.
- Recession fears seem to cap the risk-sensitive Aussie, though a weaker USD lends support.
- Traders keenly await the US consumer inflation data for January before placing fresh bets.
The pair currently trades last at 0.69656.
The previous day high was 0.6974 while the previous day low was 0.6891. The daily 38.2% Fib levels comes at 0.6942, expected to provide support. Similarly, the daily 61.8% fib level is at 0.6922, expected to provide support.
The AUD/USD pair struggles to capitalize on the previous day’s goodish rebound from sub-0.6900 levels and oscillates in a narrow band through the early European session on Tuesday. Spot prices remain below the 0.7000 psychological mark, though the downside remains cushioned amid some follow-through US Dollar selling.
In fact, the USD Index, which tracks the Greenback against a basket of currencies, moves further away from a multi-week high touched on Monday amid the ongoing decline in the US Treasury bond yields. That said, looming recession risks hold back traders from placing aggressive bets around the risk-sensitive Aussie and keep a lid on any meaningful upside for the AUD/USD pair, at least for the time being.
Traders also seem reluctant amid expectations that the Federal Reserve will stick to its hawkish stance for longer. The bets were reaffirmed by data released on Friday, which showed that consumer prices rose in December instead of falling as estimated previously. Adding to this, the University of Michigan survey’s one-year inflation expectations jumped to 4.2% this month from 3.9% in January.
Hence, the market focus will remain glued to the latest US consumer inflation figures, due for release later during the early North American session. The crucial US CPI report will play a key role in influencing the Fed’s rate-hike path, which, in turn, should drive the USD demand in the near term. This, along with broader risk sentiment, should provide some meaningful impetus to the AUD/USD pair.
Heading into the key US data risk, a more hawkish outlook by the Reserve Bank of Australia (RBA) might continue to act as a tailwind for the AUD/USD pair. In fact, the minutes of the RBA monetary policy meeting held in February signalled that further rate increases will be needed to ensure that inflation returns to target. This could lead to an extension of subdued range-bound price action.
Technical Levels: Supports and Resistances
AUDUSD currently trading at 0.6964 at the time of writing. Pair opened at 0.6966 and is trading with a change of -0.03 % .
| Overview | Overview.1 | |
|---|---|---|
| 0 | Today last price | 0.6964 |
| 1 | Today Daily Change | -0.0002 |
| 2 | Today Daily Change % | -0.0300 |
| 3 | Today daily open | 0.6966 |
The pair is trading below its 20 Daily moving average @ 0.7002, above its 50 Daily moving average @ 0.6874 , above its 100 Daily moving average @ 0.6689 and above its 200 Daily moving average @ 0.6806
| Trends | Trends.1 | |
|---|---|---|
| 0 | Daily SMA20 | 0.7002 |
| 1 | Daily SMA50 | 0.6874 |
| 2 | Daily SMA100 | 0.6689 |
| 3 | Daily SMA200 | 0.6806 |
The previous day high was 0.6974 while the previous day low was 0.6891. The daily 38.2% Fib levels comes at 0.6942, expected to provide support. Similarly, the daily 61.8% fib level is at 0.6922, expected to provide support.
Note the levels of interest below:
- Pivot support is noted at 0.6913, 0.686, 0.683
- Pivot resistance is noted at 0.6997, 0.7027, 0.708
| Levels | Levels.1 |
|---|---|
| Previous Daily High | 0.6974 |
| Previous Daily Low | 0.6891 |
| Previous Weekly High | 0.7011 |
| Previous Weekly Low | 0.6856 |
| Previous Monthly High | 0.7143 |
| Previous Monthly Low | 0.6688 |
| Daily Fibonacci 38.2% | 0.6942 |
| Daily Fibonacci 61.8% | 0.6922 |
| Daily Pivot Point S1 | 0.6913 |
| Daily Pivot Point S2 | 0.6860 |
| Daily Pivot Point S3 | 0.6830 |
| Daily Pivot Point R1 | 0.6997 |
| Daily Pivot Point R2 | 0.7027 |
| Daily Pivot Point R3 | 0.7080 |
[/s2If]
Join Our Telegram Group
")


