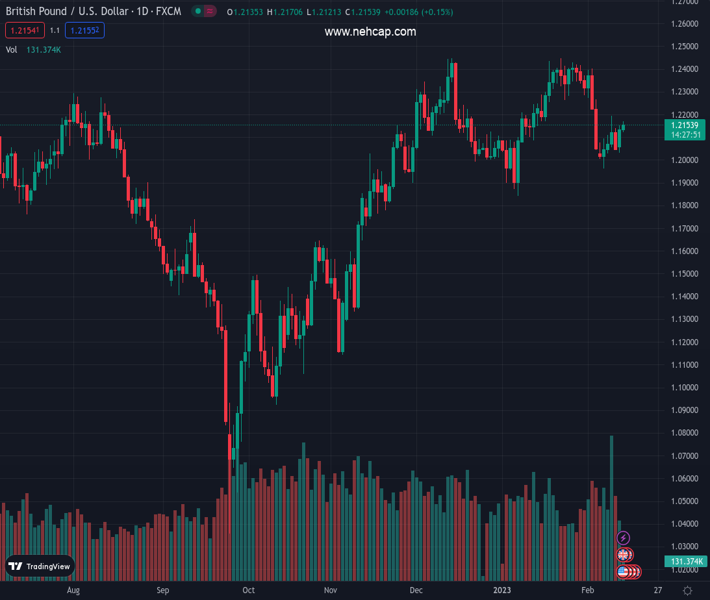
#GBPUSD @ 1.21519 scales higher for the second straight day and is supported by a combination of factors. (Pivot Orderbook analysis)
…
This is a premium post.
[s2If !current_user_can(access_s2member_level4)]Please register for PREMIUM VERSION HERE to read full post below containing analysis. In case of any error or you think you are not able to read the full post below, please email us at support#nehcap.com [lwa][/s2If] [s2If current_user_can(access_s2member_level4)]
- GBP/USD scales higher for the second straight day and is supported by a combination of factors.
- The better-than-expected UK jobs data benefits the British Pound amid sustained USD selling.
- The upside potential, however, seems limited ahead of the crucial US consumer inflation data.
The pair currently trades last at 1.21519.
The previous day high was 1.2152 while the previous day low was 1.2031. The daily 38.2% Fib levels comes at 1.2106, expected to provide support. Similarly, the daily 61.8% fib level is at 1.2077, expected to provide support.
The GBP/USD pair builds on the overnight strong intraday rally of over 100 pips from the 1.2030 region and gains traction for the second successive day on Tuesday. The pair gets an additional lift following the release of the upbeat UK jobs data and climbs to a three-day high, around the 1.2170 region during the early European session.
The UK Office for National Statistics Office for National Statistics reported that the number of people claiming unemployment-related benefits fell by 12.9K in January. Moreover, the previous month’s reading was also revised down sharply to -3.2K as compared to the 19.7 rise estimated originally. This, to a larger extent, helps offset the mixed UK wage growth data and continues to underpin the British Pound.
The US Dollar, on the other hand, is seen extending the previous day’s retracement slide from a multi-week high, which, in turn, is seen as another factor pushing the GBP/USD pair higher. That said, any subsequent move-up is more likely to remain capped. Traders might refrain from placing aggressive bets ahead of the crucial US consumer inflation figures, due for release later during the early North North American session.
The US CPI report will play a key role in influencing the Fed’s rate-hike path, which, in turn, should drive the USD demand and provide a fresh directional impetus to the GBP/USD pair. In the meantime, expectations that the Bank of England (BoE) is nearing the end of its current policy-tightening cycle could hold back bulls from placing fresh bets around the Sterling. This might further contribute to capping gains for the major.
Nevertheless, the latest leg up pushes the GBP/USD pair back closer to the 50-day SMA resistance, which should continue to act as a strong barrier. That said, a convincing breakthrough might prompt some technical buying and pave the way for some meaningful appreciating move heading into the key US data risk.
Technical Levels: Supports and Resistances
GBPUSD currently trading at 1.2161 at the time of writing. Pair opened at 1.2138 and is trading with a change of 0.19 % .
| Overview | Overview.1 | |
|---|---|---|
| 0 | Today last price | 1.2161 |
| 1 | Today Daily Change | 0.0023 |
| 2 | Today Daily Change % | 0.1900 |
| 3 | Today daily open | 1.2138 |
The pair is trading below its 20 Daily moving average @ 1.2254, below its 50 Daily moving average @ 1.2186 , above its 100 Daily moving average @ 1.1859 and above its 200 Daily moving average @ 1.1944
| Trends | Trends.1 | |
|---|---|---|
| 0 | Daily SMA20 | 1.2254 |
| 1 | Daily SMA50 | 1.2186 |
| 2 | Daily SMA100 | 1.1859 |
| 3 | Daily SMA200 | 1.1944 |
The previous day high was 1.2152 while the previous day low was 1.2031. The daily 38.2% Fib levels comes at 1.2106, expected to provide support. Similarly, the daily 61.8% fib level is at 1.2077, expected to provide support.
Note the levels of interest below:
- Pivot support is noted at 1.2062, 1.1986, 1.1941
- Pivot resistance is noted at 1.2183, 1.2228, 1.2304
| Levels | Levels.1 |
|---|---|
| Previous Daily High | 1.2152 |
| Previous Daily Low | 1.2031 |
| Previous Weekly High | 1.2194 |
| Previous Weekly Low | 1.1961 |
| Previous Monthly High | 1.2448 |
| Previous Monthly Low | 1.1841 |
| Daily Fibonacci 38.2% | 1.2106 |
| Daily Fibonacci 61.8% | 1.2077 |
| Daily Pivot Point S1 | 1.2062 |
| Daily Pivot Point S2 | 1.1986 |
| Daily Pivot Point S3 | 1.1941 |
| Daily Pivot Point R1 | 1.2183 |
| Daily Pivot Point R2 | 1.2228 |
| Daily Pivot Point R3 | 1.2304 |
[/s2If]
Join Our Telegram Group
")


