#XAUUSD @ 1,858.44 Gold price is looking to stretch its recovery move to near $1,860.00 amid a decline in safe-haven’s appeal. (Pivot Orderbook analysis)
…
This is a premium post.
[s2If !current_user_can(access_s2member_level4)]Please register for PREMIUM VERSION HERE to read full post below containing analysis. In case of any error or you think you are not able to read the full post below, please email us at support#nehcap.com [lwa][/s2If] [s2If current_user_can(access_s2member_level4)]
- Gold price is looking to stretch its recovery move to near $1,860.00 amid a decline in safe-haven’s appeal.
- Rising expectations for a surprise rise in US inflation are not providing any cushion to yields.
- Fed Bowman sees a continuation of rate hikes, pointing out there will be a lot of data releases between now and the next policy meeting.
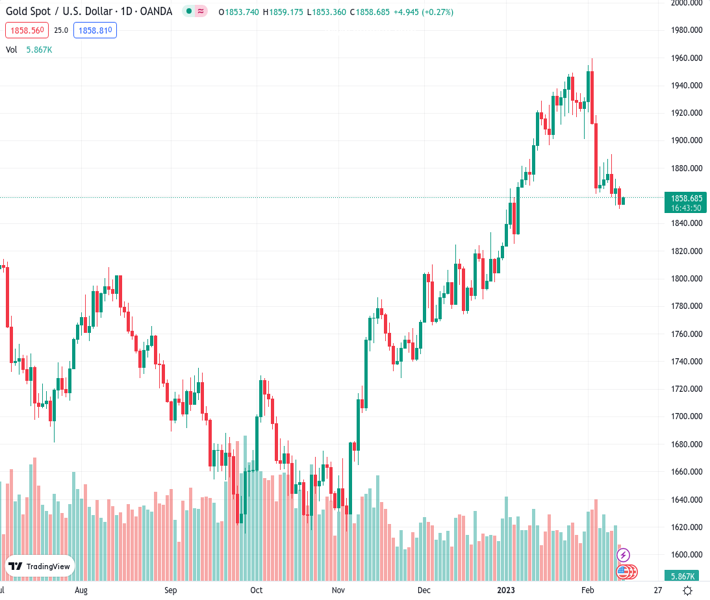
The pair currently trades last at 1858.44.
The previous day high was 1866.65 while the previous day low was 1850.48. The daily 38.2% Fib levels comes at 1856.66, expected to provide support. Similarly, the daily 61.8% fib level is at 1860.47, expected to provide resistance.
Gold price (XAU/USD) is marginally far from reclaiming the critical resistance of $1,860.00 in the Tokyo session. The precious metal recovered firmly after sensing buying interest around $1,850.00 as the US Dollar Index (DXY) surrendered the immediate support of 102.80. The further downside in the USD Index looks favored as the risk appetite of the market participants is extremely solid.
S&P500 futures are effectively recovering their minor losses, witnessed in the Asian session. Rising expectations for a surprise rise in the United States inflation is not providing any cushion to the US Treasury yields. The alpha delivered on 10-year US Treasury bonds has dropped below 3.70%.
Analysts at NBF expect “The energy component likely rebounded in the month, helping the headline index to advance 0.5%. If we’re right, the YoY rate should come down from 6.5% to 6.2%. The core index, meanwhile, may have continued to be supported by rising rent prices and advanced 0.3% on a monthly basis. This would translate into a three-tick decline of the 12-month rate to 5.4%.”
Despite a decline in the US Consumer Price Index (CPI), the Federal Reserve (Fed) won’t tone down its hawkish stance as the stubbornness in the inflationary pressures will take time in easing.
Fed Governor Michelle Bowman said on Monday the Fed will continue to raise interest rates, pointing out there will be a lot of data releases between now and the next policy meeting.
Gold price has attempted a recovery move after sensing a loss in the downside momentum near $1,850.00. The momentum oscillator, Relative Strength Index (RSI) (14), has shown that the Gold price was making Lower Highs while the oscillators delivered Higher Lows. This indicates an absence of strength in the downside momentum.
Meanwhile, the Gold price is looking to shift its business above the 20-period Exponential Moving Average (EMA) at around $1,860.00. An occurrence of the same will strengthen the Gold bulls.
Technical Levels: Supports and Resistances
XAUUSD currently trading at 1858.31 at the time of writing. Pair opened at 1854.29 and is trading with a change of 0.22 % .
| Overview | Overview.1 | |
|---|---|---|
| 0 | Today last price | 1858.31 |
| 1 | Today Daily Change | 4.02 |
| 2 | Today Daily Change % | 0.22 |
| 3 | Today daily open | 1854.29 |
The pair is trading below its 20 Daily moving average @ 1906.06, above its 50 Daily moving average @ 1857.38 , above its 100 Daily moving average @ 1778.87 and above its 200 Daily moving average @ 1775.81
| Trends | Trends.1 | |
|---|---|---|
| 0 | Daily SMA20 | 1906.06 |
| 1 | Daily SMA50 | 1857.38 |
| 2 | Daily SMA100 | 1778.87 |
| 3 | Daily SMA200 | 1775.81 |
The previous day high was 1866.65 while the previous day low was 1850.48. The daily 38.2% Fib levels comes at 1856.66, expected to provide support. Similarly, the daily 61.8% fib level is at 1860.47, expected to provide resistance.
Note the levels of interest below:
- Pivot support is noted at 1847.63, 1840.97, 1831.46
- Pivot resistance is noted at 1863.8, 1873.31, 1879.97
| Levels | Levels.1 |
|---|---|
| Previous Daily High | 1866.65 |
| Previous Daily Low | 1850.48 |
| Previous Weekly High | 1890.27 |
| Previous Weekly Low | 1852.84 |
| Previous Monthly High | 1949.27 |
| Previous Monthly Low | 1823.76 |
| Daily Fibonacci 38.2% | 1856.66 |
| Daily Fibonacci 61.8% | 1860.47 |
| Daily Pivot Point S1 | 1847.63 |
| Daily Pivot Point S2 | 1840.97 |
| Daily Pivot Point S3 | 1831.46 |
| Daily Pivot Point R1 | 1863.80 |
| Daily Pivot Point R2 | 1873.31 |
| Daily Pivot Point R3 | 1879.97 |
[/s2If]
Join Our Telegram Group
")


