WTI remains sidelined after reversing from 12-day top. (Pivot Orderbook analysis)
…
This is a premium post.
[s2If !current_user_can(access_s2member_level4)]Please register for PREMIUM VERSION HERE to read full post below containing analysis. In case of any error or you think you are not able to read the full post below, please email us at support#nehcap.com [lwa][/s2If] [s2If current_user_can(access_s2member_level4)]
- WTI remains sidelined after reversing from 12-day top.
- US SPR announces another tranche of Oil release to battle Russia-induced output crunch.
- OPEC’s Al Ghais expects a rebound in energy demand to pre-pandemic levels.
- Oil inventories, US inflation eyed for fresh impulse.
The pair currently trades last at 79.47.
The previous day high was 80.75 while the previous day low was 78.65. The daily 38.2% Fib levels comes at 79.45, expected to provide support. Similarly, the daily 61.8% fib level is at 79.95, expected to provide resistance.
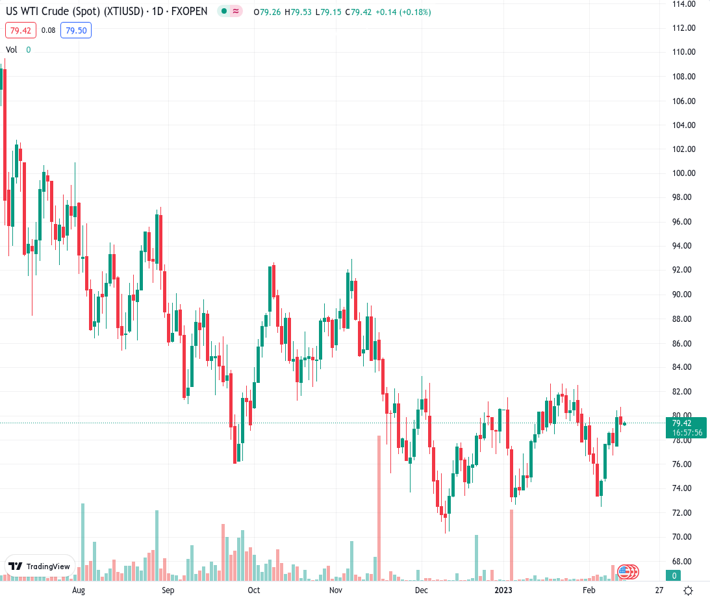
WTI crude oil remains indecisive around $79.50 during early Tuesday, after reversing from a two-week high the previous day. In doing so, the black gold portrays the market’s cautious mood ahead of the key US inflation data for January.
Also read: US Consumer Price Index Preview: US Dollar vulnerable to violent crash, every 0.1% in Core CPI matters
Adding to the commodity’s trading barriers are the mixed headlines surrounding the Oil demand and supply flows. That said, the latest blow to Oil prices could be from the news that US President Joe Biden’s team is ready for releasing another 26 million barrels of crude oil from the Strategic Petroleum Reserve (SPR).
Previously, Russia’s threat of cutting production and the hopes of more energy demand in 2023, as conveyed by Organization of the Petroleum Exporting Countries (OPEC) Secretary-General Haitham Al Ghais, seemed to have pleased the Oil buyers.
Elsewhere, fresh fears of the US-China tension over the balloon shooting also challenge the sentiment and WTI crude oil traders. US Congress will take a bipartisan look at unidentified aerial objects that have made their way into U.S. and Canadian airspace, and why they were not found sooner,” said US Senate Majority Leader Chuck Schumer. It’s worth noting that a US Military General previously ruled out odds favoring the likely hand of China in the “unidentified objects” which were shot down during the weekend.
While portraying the mood, the S&P 500 Futures remain indecisive following the biggest daily jump of the month while the US 10-year Treasury bond yields drop nearly two basis points to 3.69% at the latest, after reversing from a one-month high the previous day. Further, the US Dollar Index (DXY) remains pressured while equities in the Asia-Pacific region trade mixed at the latest.
Looking ahead, the US Consumer Price Index (CPI) for January becomes the key for markets and also for the WTI traders to watch as firmer inflation data means higher Fed rates, which in turn can weigh on the Oil price. Additionally important will be the weekly inventories from the American Petroleum Institute (API) and the US Energy Information Administration (EIA).
Failure to cross the descending resistance line from early November 2022, around $80.50, as well as the 100-DMA level of near $80.90, challenge the WTI crude oil buyers but recently firmer MACD signals tease the commodity buyers.
Technical Levels: Supports and Resistances
XTIUSD currently trading at 79.47 at the time of writing. Pair opened at 79.52 and is trading with a change of -0.06% % .
| Overview | Overview.1 | |
|---|---|---|
| 0 | Today last price | 79.47 |
| 1 | Today Daily Change | -0.05 |
| 2 | Today Daily Change % | -0.06% |
| 3 | Today daily open | 79.52 |
The pair is trading above its 20 Daily moving average @ 78.92, above its 50 Daily moving average @ 77.51 , below its 100 Daily moving average @ 80.89 and below its 200 Daily moving average @ 89.96
| Trends | Trends.1 | |
|---|---|---|
| 0 | Daily SMA20 | 78.92 |
| 1 | Daily SMA50 | 77.51 |
| 2 | Daily SMA100 | 80.89 |
| 3 | Daily SMA200 | 89.96 |
The previous day high was 80.75 while the previous day low was 78.65. The daily 38.2% Fib levels comes at 79.45, expected to provide support. Similarly, the daily 61.8% fib level is at 79.95, expected to provide resistance.
Note the levels of interest below:
- Pivot support is noted at 78.53, 77.54, 76.43
- Pivot resistance is noted at 80.63, 81.74, 82.73
| Levels | Levels.1 |
|---|---|
| Previous Daily High | 80.75 |
| Previous Daily Low | 78.65 |
| Previous Weekly High | 80.48 |
| Previous Weekly Low | 72.50 |
| Previous Monthly High | 82.68 |
| Previous Monthly Low | 72.64 |
| Daily Fibonacci 38.2% | 79.45 |
| Daily Fibonacci 61.8% | 79.95 |
| Daily Pivot Point S1 | 78.53 |
| Daily Pivot Point S2 | 77.54 |
| Daily Pivot Point S3 | 76.43 |
| Daily Pivot Point R1 | 80.63 |
| Daily Pivot Point R2 | 81.74 |
| Daily Pivot Point R3 | 82.73 |
[/s2If]
Join Our Telegram Group
")


