#USDINR @ 82.6100 is aiming to deliver a break above 82.60 as the USD Index is eyeing more weakness. (Pivot Orderbook analysis)
…
This is a premium post.
[s2If !current_user_can(access_s2member_level4)]Please register for PREMIUM VERSION HERE to read full post below containing analysis. In case of any error or you think you are not able to read the full post below, please email us at support#nehcap.com [lwa][/s2If] [s2If current_user_can(access_s2member_level4)]
- USD/INR is aiming to deliver a break above 82.60 as the USD Index is eyeing more weakness.
- The market mood is upbeat as investors have digested the consequences associated if US inflation delivers a surprise jump.
- To tame core inflation, the RBI might hike its repo rate further by 25bps.
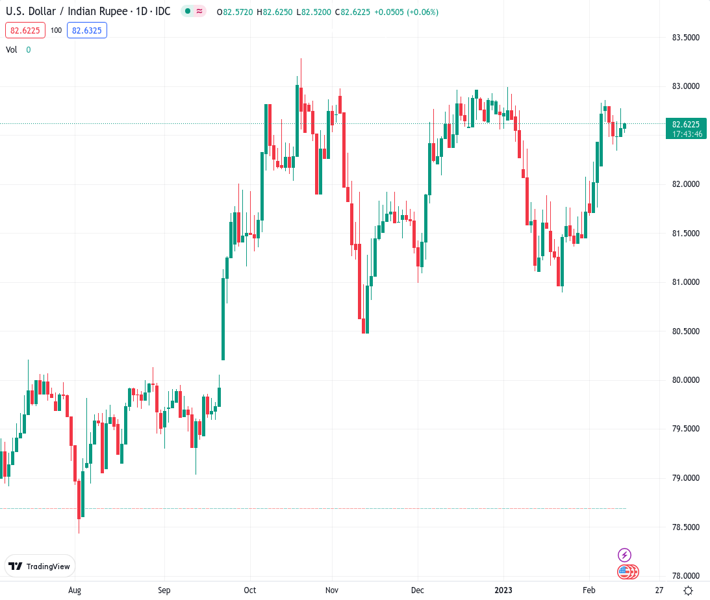
The pair currently trades last at 82.6100.
The previous day high was 82.7802 while the previous day low was 82.4892. The daily 38.2% Fib levels comes at 82.669, expected to provide resistance. Similarly, the daily 61.8% fib level is at 82.6003, expected to provide support.
The USD/INR pair is struggling to extend above the immediate resistance of 82.60 in the Asian session. The upside move in the asset looks favored as the US Dollar Index (DXY) has recorded a fresh day’s low at 102.81. The USD Index is looking for more downside as the overall market sentiment is extremely positive.
Investors have digested the consequences associated if United States inflation delivering a surprise jump after declining meaningfully for the past six months consecutively. Therefore, the demand for risk-perceived assets has improved dramatically. S&P500 futures have recovered some of their losses, portraying a recovery in the risk appetite theme. The demand for US government bonds is escalating vigorously, which has trimmed the return generated on the 10-year US Treasury yields to 3.70%.
On an overall note, the street is worried that a surprise rise in the core Consumer Price Index (CPI) could force the Federal Reserve (Fed) to maintain higher interest rates for a longer period.
Ace editor of the Wall Street Journal (WSJ) Nick Timiraos cited the Federal Reserve’s (Fed) research paper titled, “Residual Seasonality in Core Consumer Price Inflation: An Update,” to justify his expectations stating, “Core inflation has generally come in higher in the first of the year than the second half of the year.”
Meanwhile, the Indian Rupee bulls are likely to remain solid as the Reserve Bank of India (RBI) might look for tightening the policy further to impact the core inflation. Economists at Commerzbank see at least another 25 bps hike in the first half this year and possibly even 50 bps particularly if domestic demand remains firm and core inflation fails to cool. This should provide some support for INR.
Meanwhile, the oil price has turned sideways above $79.00 ahead of the release of the US inflation data. It is worth noting that India is one of the leading importers of oil in the world and volatility in oil prices impacts the Indian Rupee critically.
Technical Levels: Supports and Resistances
USDINR currently trading at 82.5995 at the time of writing. Pair opened at 82.6107 and is trading with a change of -0.01 % .
| Overview | Overview.1 | |
|---|---|---|
| 0 | Today last price | 82.5995 |
| 1 | Today Daily Change | -0.0112 |
| 2 | Today Daily Change % | -0.0100 |
| 3 | Today daily open | 82.6107 |
The pair remains strongly bullish on the daily timeframe. It trades above its 20 SMA @ 81.9066, 50 SMA 82.216, 100 SMA @ 82.0582 and 200 SMA @ 80.5209.
| Trends | Trends.1 | |
|---|---|---|
| 0 | Daily SMA20 | 81.9066 |
| 1 | Daily SMA50 | 82.2160 |
| 2 | Daily SMA100 | 82.0582 |
| 3 | Daily SMA200 | 80.5209 |
The previous day high was 82.7802 while the previous day low was 82.4892. The daily 38.2% Fib levels comes at 82.669, expected to provide resistance. Similarly, the daily 61.8% fib level is at 82.6003, expected to provide support.
Note the levels of interest below:
- Pivot support is noted at 82.4732, 82.3356, 82.1821
- Pivot resistance is noted at 82.7642, 82.9177, 83.0553
| Levels | Levels.1 |
|---|---|
| Previous Daily High | 82.7802 |
| Previous Daily Low | 82.4892 |
| Previous Weekly High | 82.9399 |
| Previous Weekly Low | 82.1626 |
| Previous Monthly High | 83.0720 |
| Previous Monthly Low | 80.8822 |
| Daily Fibonacci 38.2% | 82.6690 |
| Daily Fibonacci 61.8% | 82.6003 |
| Daily Pivot Point S1 | 82.4732 |
| Daily Pivot Point S2 | 82.3356 |
| Daily Pivot Point S3 | 82.1821 |
| Daily Pivot Point R1 | 82.7642 |
| Daily Pivot Point R2 | 82.9177 |
| Daily Pivot Point R3 | 83.0553 |
[/s2If]
Join Our Telegram Group
")


