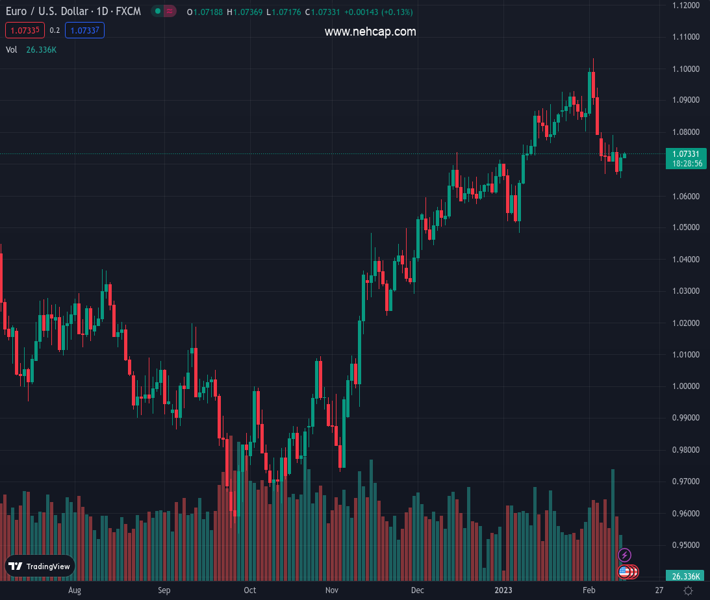
#EURUSD @ 1.07330 is marching towards 1.0770 as USD Index is showing signs of more weakness ahead. (Pivot Orderbook analysis)
…
This is a premium post.
[s2If !current_user_can(access_s2member_level4)]Please register for PREMIUM VERSION HERE to read full post below containing analysis. In case of any error or you think you are not able to read the full post below, please email us at support#nehcap.com [lwa][/s2If] [s2If current_user_can(access_s2member_level4)]
- EUR/USD is marching towards 1.0770 as USD Index is showing signs of more weakness ahead.
- S&P500 futures have witnessed a minor correction, portraying caution in fresh buying in an overall upbeat market mood.
- Eurozone GDP looks set to dodge recession amid an absence of contraction in activities.
The pair currently trades last at 1.07330.
The previous day high was 1.073 while the previous day low was 1.0656. The daily 38.2% Fib levels comes at 1.0702, expected to provide support. Similarly, the daily 61.8% fib level is at 1.0684, expected to provide support.
The EUR/USD pair refreshed its day’s high around 1.0730 and is hovering around it continuously in the Tokyo session. The major currency pair is expected to continue its upside momentum as the US Dollar Index (DXY) is struggling to place feet ahead of the United States Consumer Price Index (CPI) data. The USD Index (DXY) has shifted its business below 103.00 and is expected to continue its downside journey as investors have ignored inflation’s upside risks.
S&P500 futures have witnessed a minor correction in the Asian session, portraying a caution for fresh buying while the broader market mood is extremely solid. Fears associated with airborne threats-headlines to the United States have eased, which has trimmed the appeal for safe-haven assets. A decline in investors’ anxiety about US inflation has improved demand for US government bonds. This has led to a decline in the 10-year US Treasury yields to 3.70%.
The movement for the US Dollar highly banks upon January’s inflation report as higher-than-anticipated inflation could fade the downside risks. Goldman Sachs, on inflation expectations, mentioned that their economists have argued that inflation readings might be stronger at the start of the year because a disproportionate number of prices are reset at the start of the year, and firms might set contract rates higher than usual in the current environment.
The investment banking firm further added “If the January inflation data fail to “rise to the occasion,” then the macro backdrop could continue to push towards Dollar depreciation.”
On the Eurozone front, investors are awaiting the release of the preliminary Gross Domestic Product (GDP) (Q4). Considering the consensus, the economy has managed to deliver constant growth akin to the prior figures.
Meanwhile, the quarterly European Commission (EC) report, depicts a decline in the inflation projections and higher anticipation for economic growth, citing labor market and consumer spending as resilient.
Technical Levels: Supports and Resistances
EURUSD currently trading at 1.0732 at the time of writing. Pair opened at 1.0723 and is trading with a change of 0.08 % .
| Overview | Overview.1 | |
|---|---|---|
| 0 | Today last price | 1.0732 |
| 1 | Today Daily Change | 0.0009 |
| 2 | Today Daily Change % | 0.0800 |
| 3 | Today daily open | 1.0723 |
The pair is trading below its 20 Daily moving average @ 1.082, above its 50 Daily moving average @ 1.0711 , above its 100 Daily moving average @ 1.0374 and above its 200 Daily moving average @ 1.0324
| Trends | Trends.1 | |
|---|---|---|
| 0 | Daily SMA20 | 1.0820 |
| 1 | Daily SMA50 | 1.0711 |
| 2 | Daily SMA100 | 1.0374 |
| 3 | Daily SMA200 | 1.0324 |
The previous day high was 1.073 while the previous day low was 1.0656. The daily 38.2% Fib levels comes at 1.0702, expected to provide support. Similarly, the daily 61.8% fib level is at 1.0684, expected to provide support.
Note the levels of interest below:
- Pivot support is noted at 1.0676, 1.0628, 1.0601
- Pivot resistance is noted at 1.075, 1.0777, 1.0825
| Levels | Levels.1 |
|---|---|
| Previous Daily High | 1.0730 |
| Previous Daily Low | 1.0656 |
| Previous Weekly High | 1.0799 |
| Previous Weekly Low | 1.0666 |
| Previous Monthly High | 1.0930 |
| Previous Monthly Low | 1.0483 |
| Daily Fibonacci 38.2% | 1.0702 |
| Daily Fibonacci 61.8% | 1.0684 |
| Daily Pivot Point S1 | 1.0676 |
| Daily Pivot Point S2 | 1.0628 |
| Daily Pivot Point S3 | 1.0601 |
| Daily Pivot Point R1 | 1.0750 |
| Daily Pivot Point R2 | 1.0777 |
| Daily Pivot Point R3 | 1.0825 |
[/s2If]
Join Our Telegram Group
")


