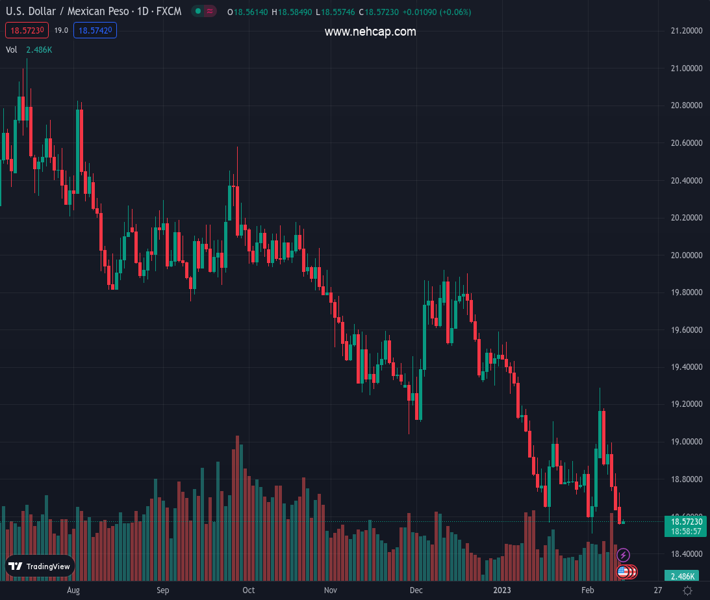
#USDMXN @ 18.5715 picks up bids to snap three-day downtrend around the lowest levels in eight days. (Pivot Orderbook analysis)
…
This is a premium post.
[s2If !current_user_can(access_s2member_level4)]Please register for PREMIUM VERSION HERE to read full post below containing analysis. In case of any error or you think you are not able to read the full post below, please email us at support#nehcap.com [lwa][/s2If] [s2If current_user_can(access_s2member_level4)]
- USD/MXN picks up bids to snap three-day downtrend around the lowest levels in eight days.
- Hawkish Fed speak, hopes of positive surprise from US CPI weigh on market sentiment and test US Dollar bears.
- Fresh fears surrounding China, cautious mood ahead of multiple catalysts from elsewhere also challenge Mexican Peso pair bears.
The pair currently trades last at 18.5715.
The previous day high was 18.7285 while the previous day low was 18.5779. The daily 38.2% Fib levels comes at 18.6355, expected to provide resistance. Similarly, the daily 61.8% fib level is at 18.671, expected to provide resistance.
USD/MXN licks its wounds near 18.60 as it bounces off the weekly low during early Tuesday, teasing the first positive performance in four. It’s worth noting, however, that the Mexican Peso (MXN) pair remains near the multi-month low of 18.50 marked in February.
That said, the pair’s latest rebound could be linked to the US Dollar’s U-turn from the intraday low as market players rush for risk safety ahead of the key US Consumer Price Index (CPI) for January. Adding strength to the rebound are the hawkish statements from the Federal Reserve (Fed) officials and China concerns, not to forget anxiety ahead of the employment and growth numbers from the Eurozone and the UK.
While portraying the mood, the S&P 500 Futures print mild losses around 4,140, following the biggest daily jump of the month. That said, the US 10-year Treasury bond yields drop nearly two basis points to 3.69% at the latest, after reversing from a one-month high the previous day. It should be noted that the US Dollar Index (DXY) remains pressured while equities in the Asia-Pacific region trade mixed at the latest.
On Monday, Fed Governor Michelle Bowman said that the Federal Reserve will need to continue to raise interest rates in order to get them to a level high enough to bring inflation back down to the central bank’s target rate, per Reuters. On the same line, Philadelphia Federal Reserve President Patrick Harker pushed back the chatters of a Fed rate cut during 2023 while crossing wires in the weekend. However, the policymaker did mention, “Fed not likely to cut this year but may be able to in 2024 if inflation starts ebbing,” per Reuters.
The hawkish Fed talks join the fresh Sino-American tension over the spying attempts via the balloons to weigh on sentiment and put a floor under the USD/MXN prices. “US Congress will take a bipartisan look at unidentified aerial objects that have made their way into U.S. and Canadian airspace, and why they were not found sooner,” said US Senate Majority Leader Chuck Schumer. It’s worth noting that a US Military General previously ruled out odds favoring the likely hand of China in the “unidentified objects” which were shot down during the weekend.
Apart from what was mentioned above, the absence of the Mexican data also allows the USD/MXN pair to pare the Banxico-inflicted wounds.
It should be observed that the last week’s surprise 0.50% rate hike from Banxico has been pleasing the USD/MXN as traders await the US CPI, expected 6.2% YoY versus 6.5%.
Also read: US Consumer Price Index Preview: US Dollar vulnerable to violent crash, every 0.1% in Core CPI matters
Unless crossing a one-week-old descending resistance line, around 18.70 by the press time, USD/MXN remains vulnerable to refreshing the yearly low of 18.50, marked earlier in February.
Technical Levels: Supports and Resistances
USDMXN currently trading at 18.5724 at the time of writing. Pair opened at 18.5842 and is trading with a change of -0.06% % .
| Overview | Overview.1 | |
|---|---|---|
| 0 | Today last price | 18.5724 |
| 1 | Today Daily Change | -0.0118 |
| 2 | Today Daily Change % | -0.06% |
| 3 | Today daily open | 18.5842 |
The pair remains strongly bearish on the daily time frame. It trades below the 20 SMA @ 18.8123, 50 SMA 19.1863, 100 SMA @ 19.4579 and 200 SMA @ 19.7961.
| Trends | Trends.1 | |
|---|---|---|
| 0 | Daily SMA20 | 18.8123 |
| 1 | Daily SMA50 | 19.1863 |
| 2 | Daily SMA100 | 19.4579 |
| 3 | Daily SMA200 | 19.7961 |
The previous day high was 18.7285 while the previous day low was 18.5779. The daily 38.2% Fib levels comes at 18.6355, expected to provide resistance. Similarly, the daily 61.8% fib level is at 18.671, expected to provide resistance.
Note the levels of interest below:
- Pivot support is noted at 18.5319, 18.4796, 18.3813
- Pivot resistance is noted at 18.6825, 18.7808, 18.8331
| Levels | Levels.1 |
|---|---|
| Previous Daily High | 18.7285 |
| Previous Daily Low | 18.5779 |
| Previous Weekly High | 19.2901 |
| Previous Weekly Low | 18.6390 |
| Previous Monthly High | 19.5361 |
| Previous Monthly Low | 18.5663 |
| Daily Fibonacci 38.2% | 18.6355 |
| Daily Fibonacci 61.8% | 18.6710 |
| Daily Pivot Point S1 | 18.5319 |
| Daily Pivot Point S2 | 18.4796 |
| Daily Pivot Point S3 | 18.3813 |
| Daily Pivot Point R1 | 18.6825 |
| Daily Pivot Point R2 | 18.7808 |
| Daily Pivot Point R3 | 18.8331 |
[/s2If]
Join Our Telegram Group
")


