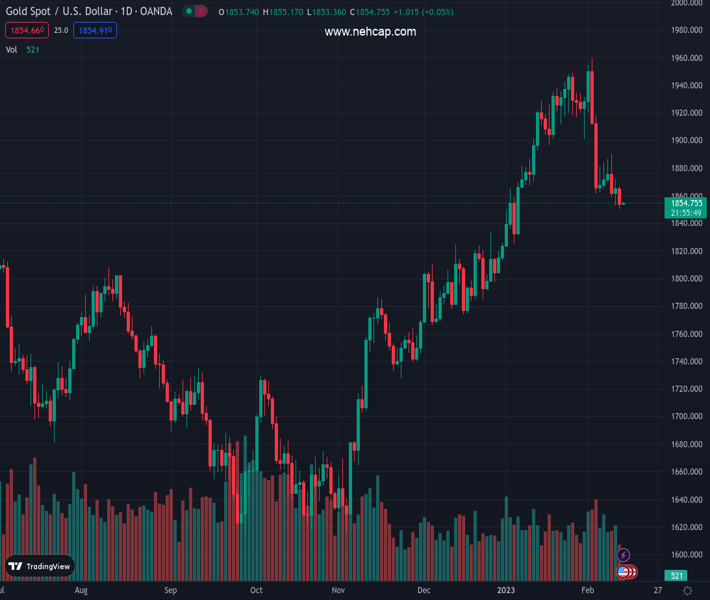
#XAUUSD @ 1,854.85 Gold price remains pressured around the lowest levels in five weeks., @nehcap view: Further downside expected (Pivot Orderbook analysis)
…
This is a premium post.
[s2If !current_user_can(access_s2member_level4)]Please register for PREMIUM VERSION HERE to read full post below containing analysis. In case of any error or you think you are not able to read the full post below, please email us at support#nehcap.com [lwa][/s2If] [s2If current_user_can(access_s2member_level4)]
- Gold price remains pressured around the lowest levels in five weeks.
- Markets preparations for United States Consumer Price Index for January weigh on XAU/USD price amid hawkish Federal Reserve talks.
- Risk-on mood, softer US Dollar failed to provide tailwind to the Gold price.
- Gold buyers need downbeat US CPI but inflation expectations are again on the move.
The pair currently trades last at 1854.85.
The previous day high was 1872.33 while the previous day low was 1852.84. The daily 38.2% Fib levels comes at 1864.88, expected to provide resistance. Similarly, the daily 61.8% fib level is at 1860.29, expected to provide resistance.
Gold price (XAU/USD) holds lower ground at the monthly bottom surrounding $1,855, following the slump to early January levels the previous day, as markets brace for the United States Consumer Price Index (CPI) for January. Also pausing the XAU/USD’s declines is the US Dollar pullback, as well as the firmer sentiment. However, hawkish comments from the Federal Reserve (Fed) officials and firmer US inflation expectations seem to keep the Gold bears hopeful ahead of the key data.
Federal Reserve (Fed) officials defend the rate hikes and are far from suggesting the policy pivot, which in turn keeps the market’s fears of tighter monetary policy actions moving forward and the same weighs on the Gold price. Fed Governor Michelle Bowman said on Monday that the Federal Reserve will need to continue to raise interest rates in order to get them to a level high enough to bring inflation back down to the central bank’s target rate, per Reuters. Before him, Philadelphia Federal Reserve President Patrick Harker pushed back the chatters of a Fed rate cut during 2023. However, the policymaker did mention, “Fed not likely to cut this year but may be able to in 2024 if inflation starts ebbing.” His comments were mostly in line with Fed Chair Jerome Powell’s cautious optimism and exerted downside pressure on the US Dollar.
Although the market forecasts hint at the easing of the United States Consumer Price Index (CPI) for January to 6.2% YoY from 6.5%, the US inflation expectations remain firmer around the monthly highs and underpin the hawkish Fed bias. That said, the US inflation expectations per the 10-year and 5-year breakeven inflation rates from the St. Louis Federal Reserve (FRED) remain firmer around the monthly highs, close 2.31% and 2.44% at the latest. It’s worth noting that the University of Michigan also lifted its one-year ahead inflation projections while keeping the five-year forecasts intact.
The risk profile was mostly upbeat on Monday, after a downbeat start, as fears surrounding the unidentified flying objects near the United States and China, one of which was recently confirmed as like a metal ball, eased afterward on comments from the US General. That said, the US military authority turned down the fears while rejecting calls to believe that those flying objects were from China. Adding strength to the risk-on mood were upbeat US equities and a pullback in the US Treasury bond yields after multiple days of run-up.
It should be noted that the US Dollar Index (DXY) retreated from a one-week high on Monday, sidelined near 103.30 by the press time, as traders prepare for the key US data.
While the softer sentiment and the US Dollar’s pullback should put a floor under the Gold price, the metal failed to cheer any of it and remained depressed near the five-week low.
Gold traders should emphasize the US CPI data for January as the recent Federal Reserve (Fed) comments appear light when suggesting more rate hikes. Also, the Fed policy pivot talks aren’t far from the table and hence any disappointment from the US inflation numbers won’t hesitate to propel the Gold price.
Also read: Gold Price Forecast: $1,800 barrier not that far away
Following a downside break of the 200-Simple Moving Average (SMA), the Gold price forms a bearish triangle pattern while portraying consolidation of downside moves ahead of the key United States inflation.
That said, the 50-SMA pierces off the 200-SMA from above and prints a bearish moving average crossover called the “Death cross”, suggesting further weakness of the Gold price.
Also portraying the XAU/USD inaction are the recently sluggish Moving Average Convergence and Divergence (MACD) signals and the downbeat Relative Strength Index (RSI), placed at 14.
Even so, the lower line of the stated triangle, around $1,845 by the press time, restricts short-term XAU/USD downside before directing Gold bears towards a horizontal area comprising multiple levels marked since the last December, close to $1,825.
Alternatively, an upside clearance of the aforementioned triangle’s top line, close to $1,855 at the latest, could trigger a corrective bounce toward the 50-SMA hurdle surrounding $1,880. However, Gold buyers remain off the table unless witnessing successful trading beyond the 200-SMA resistance, close to $1,890 at the latest.
Overall, the Gold price flashes bearish signals as the key data/events loom.
Trend: Further downside expected
Technical Levels: Supports and Resistances
XAUUSD currently trading at 1853.64 at the time of writing. Pair opened at 1864.33 and is trading with a change of -0.57% % .
| Overview | Overview.1 | |
|---|---|---|
| 0 | Today last price | 1853.64 |
| 1 | Today Daily Change | -10.69 |
| 2 | Today Daily Change % | -0.57% |
| 3 | Today daily open | 1864.33 |
The pair is trading below its 20 Daily moving average @ 1909.06, below its 50 Daily moving average @ 1855.63 , above its 100 Daily moving average @ 1776.55 and above its 200 Daily moving average @ 1775.81
| Trends | Trends.1 | |
|---|---|---|
| 0 | Daily SMA20 | 1909.06 |
| 1 | Daily SMA50 | 1855.63 |
| 2 | Daily SMA100 | 1776.55 |
| 3 | Daily SMA200 | 1775.81 |
The previous day high was 1872.33 while the previous day low was 1852.84. The daily 38.2% Fib levels comes at 1864.88, expected to provide resistance. Similarly, the daily 61.8% fib level is at 1860.29, expected to provide resistance.
Note the levels of interest below:
- Pivot support is noted at 1854.0, 1843.68, 1834.51
- Pivot resistance is noted at 1873.49, 1882.66, 1892.98
| Levels | Levels.1 |
|---|---|
| Previous Daily High | 1872.33 |
| Previous Daily Low | 1852.84 |
| Previous Weekly High | 1890.27 |
| Previous Weekly Low | 1852.84 |
| Previous Monthly High | 1949.27 |
| Previous Monthly Low | 1823.76 |
| Daily Fibonacci 38.2% | 1864.88 |
| Daily Fibonacci 61.8% | 1860.29 |
| Daily Pivot Point S1 | 1854.00 |
| Daily Pivot Point S2 | 1843.68 |
| Daily Pivot Point S3 | 1834.51 |
| Daily Pivot Point R1 | 1873.49 |
| Daily Pivot Point R2 | 1882.66 |
| Daily Pivot Point R3 | 1892.98 |
[/s2If]
Join Our Telegram Group
")


