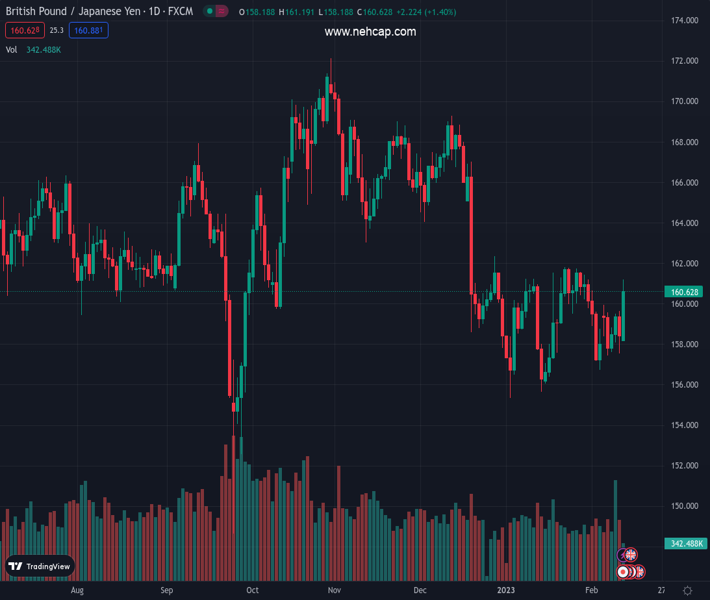
#GBPJPY @ 160.731 The rallied more than 200 pips on Monday, ahead of the release of US inflation data. (Pivot Orderbook analysis)
…
This is a premium post.
[s2If !current_user_can(access_s2member_level4)]Please register for PREMIUM VERSION HERE to read full post below containing analysis. In case of any error or you think you are not able to read the full post below, please email us at support#nehcap.com [lwa][/s2If] [s2If current_user_can(access_s2member_level4)]
- The GBP/JPY rallied more than 200 pips on Monday, ahead of the release of US inflation data.
- GBP/JPY Price Analysis: Short term, could challenge 158.00; otherwise, a rally to 162.00 is on the cards.
The pair currently trades last at 160.731.
The previous day high was 159.64 while the previous day low was 157.53. The daily 38.2% Fib levels comes at 158.34, expected to provide support. Similarly, the daily 61.8% fib level is at 158.83, expected to provide support.
The GBP/JPY breaks above the top of a trading range, advancing sharply toward the top-trendline of a descending triangle in a downtrend, at 161.19, the day’s high, but retraced some of its gains. Hence, the GBP/JPY is trading at 160.66, above its opening price by 1.43%.
After reaching the day’s high in the session, the GBP/JPY did not hold to its gains above the 50-day Exponential Moving Average (EMA) at 160.78. That would have opened the door to challenge the confluence of the 200 and 100-day EMAs, each at 161.81 and 162.00. However, the symmetrical triangle top trendline capped the advancement as bears piled in, dragging prices lower.
In the short term, the GBP/JPY four-hour chart portrays the cross-currency as range-bound based on the EMAs residing beneath the spot price. Nevertheless, as the Relative Strength Index (RSI) turned overbought but exited from that territory, the GBP/JPY dropped from around daily/weekly highs.
If the GBP/JPY edges downwards, it will face a solid support area. Firstly the 200-EMA at 160.03, which, once cleared, could pave the way towards the 159.14/32 area, the confluence of the 20/50/100 EMAs. A decisive break will send the GBP/JPY diving towards the ascending triangle bottom trendline at around 158.18.
On the flip side, if the GBP/JPY reclaims 161.80, it will open the door to challenge 162.00.
Technical Levels: Supports and Resistances
GBPJPY currently trading at 160.72 at the time of writing. Pair opened at 158.41 and is trading with a change of 1.46 % .
| Overview | Overview.1 | |
|---|---|---|
| 0 | Today last price | 160.72 |
| 1 | Today Daily Change | 2.31 |
| 2 | Today Daily Change % | 1.46 |
| 3 | Today daily open | 158.41 |
The pair is trading above its 20 Daily moving average @ 159.44, below its 50 Daily moving average @ 161.18 , below its 100 Daily moving average @ 163.43 and below its 200 Daily moving average @ 163.22
| Trends | Trends.1 | |
|---|---|---|
| 0 | Daily SMA20 | 159.44 |
| 1 | Daily SMA50 | 161.18 |
| 2 | Daily SMA100 | 163.43 |
| 3 | Daily SMA200 | 163.22 |
The previous day high was 159.64 while the previous day low was 157.53. The daily 38.2% Fib levels comes at 158.34, expected to provide support. Similarly, the daily 61.8% fib level is at 158.83, expected to provide support.
Note the levels of interest below:
- Pivot support is noted at 157.42, 156.42, 155.32
- Pivot resistance is noted at 159.52, 160.63, 161.62
| Levels | Levels.1 |
|---|---|
| Previous Daily High | 159.64 |
| Previous Daily Low | 157.53 |
| Previous Weekly High | 159.96 |
| Previous Weekly Low | 157.43 |
| Previous Monthly High | 161.85 |
| Previous Monthly Low | 155.36 |
| Daily Fibonacci 38.2% | 158.34 |
| Daily Fibonacci 61.8% | 158.83 |
| Daily Pivot Point S1 | 157.42 |
| Daily Pivot Point S2 | 156.42 |
| Daily Pivot Point S3 | 155.32 |
| Daily Pivot Point R1 | 159.52 |
| Daily Pivot Point R2 | 160.63 |
| Daily Pivot Point R3 | 161.62 |
[/s2If]
Join Our Telegram Group
")


