#USDJPY @ 132.503 advanced sharply toward 132.40 on Monday, spurred by a risk-on impulse. (Pivot Orderbook analysis)
…
This is a premium post.
[s2If !current_user_can(access_s2member_level4)]Please register for PREMIUM VERSION HERE to read full post below containing analysis. In case of any error or you think you are not able to read the full post below, please email us at support#nehcap.com [lwa][/s2If] [s2If current_user_can(access_s2member_level4)]
- USD/JPY advanced sharply toward 132.40 on Monday, spurred by a risk-on impulse.
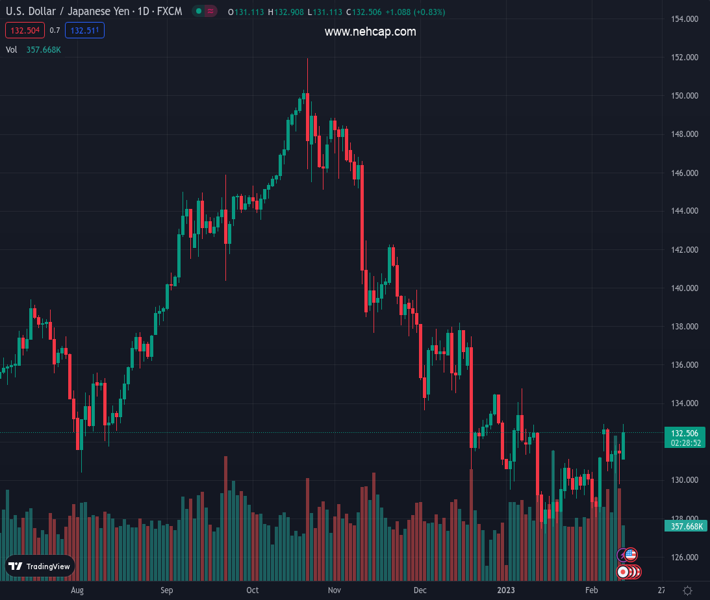
- The daily chart suggests the pair as neutral-upwards biased.
- Short term, the USD/JPY 4-hour chart, depicts the pair would trade within 131.80-133.00.
The pair currently trades last at 132.503.
The previous day high was 131.89 while the previous day low was 129.81. The daily 38.2% Fib levels comes at 130.6, expected to provide support. Similarly, the daily 61.8% fib level is at 131.09, expected to provide support.
The USD/JPY climbs as the New York session progresses, up by 0.77%, hitting a new six-week high at 132.90. Nevertheless, the major failed to hold to its gains and was rejected toward the 132.40 area. At the time of writing, the USD/JPY is trading at 132.44.
From a daily chart perspective, the USD/JPY climbed and pierced the last week’s high around 132.90 to retreat to 132.50s. The USD/JPY retracement was spurred by the 50-day Exponential Moving Average (EMA) At 132.66; albeit broken, the USD/JPY pair slid beneath the latter. Although the pair is trading off the day’s high, the USD/JPY bias in the near term is tilted to the upside.
Zooming into the 4-hour chart, after the USD/JPY consolidated during the last week in the 130.30-131.80 area, it broke the top of the range, but solid resistance around 133.00, capped the USD/JPY rally. Nevertheless, the USD/JPY might begin trading in a higher range, within the 131.80-133.00 area, ahead of US inflation data to be revealed on Tuesday, around 13:30 GMT
If the report shows that inflation continues to edge lower, the USD/JPY could aim toward the 200-EMA at 131.49, ahead of the 131.00 figure. Once those demand areas are cleared, the 100-EMA would be exposed at 130.84.
Conversely, higher-than-expected inflation would pave the way for further upside. Therefore, the USD/JPY first resistance would be 133.00. Break above, and the 134.00 figure is next, followed by the January 6 high at 134.77.
Technical Levels: Supports and Resistances
USDJPY currently trading at 132.5 at the time of writing. Pair opened at 131.41 and is trading with a change of 0.83 % .
| Overview | Overview.1 | |
|---|---|---|
| 0 | Today last price | 132.50 |
| 1 | Today Daily Change | 1.09 |
| 2 | Today Daily Change % | 0.83 |
| 3 | Today daily open | 131.41 |
The pair is trading above its 20 Daily moving average @ 130.09, above its 50 Daily moving average @ 132.27 , below its 100 Daily moving average @ 138.2 and below its 200 Daily moving average @ 136.83
| Trends | Trends.1 | |
|---|---|---|
| 0 | Daily SMA20 | 130.09 |
| 1 | Daily SMA50 | 132.27 |
| 2 | Daily SMA100 | 138.20 |
| 3 | Daily SMA200 | 136.83 |
The previous day high was 131.89 while the previous day low was 129.81. The daily 38.2% Fib levels comes at 130.6, expected to provide support. Similarly, the daily 61.8% fib level is at 131.09, expected to provide support.
Note the levels of interest below:
- Pivot support is noted at 130.18, 128.96, 128.1
- Pivot resistance is noted at 132.27, 133.12, 134.35
| Levels | Levels.1 |
|---|---|
| Previous Daily High | 131.89 |
| Previous Daily Low | 129.81 |
| Previous Weekly High | 132.91 |
| Previous Weekly Low | 129.81 |
| Previous Monthly High | 134.78 |
| Previous Monthly Low | 127.22 |
| Daily Fibonacci 38.2% | 130.60 |
| Daily Fibonacci 61.8% | 131.09 |
| Daily Pivot Point S1 | 130.18 |
| Daily Pivot Point S2 | 128.96 |
| Daily Pivot Point S3 | 128.10 |
| Daily Pivot Point R1 | 132.27 |
| Daily Pivot Point R2 | 133.12 |
| Daily Pivot Point R3 | 134.35 |
[/s2If]
Join Our Telegram Group
")


