#XAGUSD @ 22.304 Silver price seesaws between 50% and 61.8% Fibonacci retracement levels so far in the week., @nehcap view: Further downside expected (Pivot Orderbook analysis)
…
This is a premium post.
[s2If !current_user_can(access_s2member_level4)]Please register for PREMIUM VERSION HERE to read full post below containing analysis. In case of any error or you think you are not able to read the full post below, please email us at support#nehcap.com [lwa][/s2If] [s2If current_user_can(access_s2member_level4)]
- Silver price seesaws between 50% and 61.8% Fibonacci retracement levels so far in the week.
- 21-EMA adds to the upside filters while downbeat RSI teases XAG/USD sellers.
- The $21.70, $20.90 can probe bears below the “Golden ratio”.
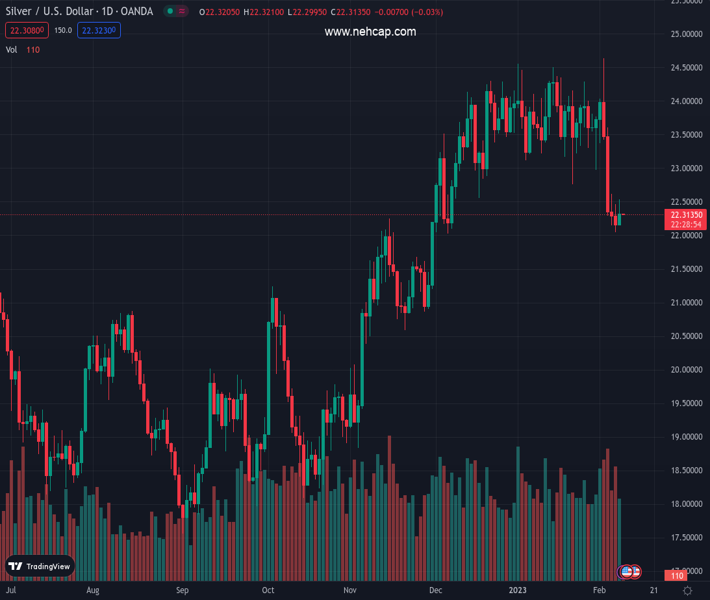
The pair currently trades last at 22.304.
The previous day high was 22.46 while the previous day low was 22.05. The daily 38.2% Fib levels comes at 22.21, expected to provide support. Similarly, the daily 61.8% fib level is at 22.3, expected to provide support.
Silver price (XAG/USD) fades the previous day’s recovery moves as it retreats to $22.30 during early Thursday in Asia. Even so, the bright metal defends the weekly trading range inside crucial Fibonacci retracement levels of the quote’s upside from late November 2022 to early February 2023.
Even if the $0.50 range restricts Silver price moves of late, RSI conditions and the 21-bar Exponential Moving Average (EMA), around $22.50 by the press time, make it hard for the buyers to take control.
In a case where XAG/USD crosses the weekly trading range between $22.10 and $22.60, described by the 61.8% and 50% Fibonacci retracement levels respectively, the metal price could aim for the $23.00 round figure.
Following that, multiple hurdles near $23.10-15 could test the upside momentum before directing the quote to the $24.50 hurdle. Also acting as an upside filter is the monthly peak of $24.63.
On the flip side, a clear break of the $22.10 range support needs validation from the $22.00 round figure to convince the Silver bears.
In that case, the November 24 high near $21.70 and November 29 swing low near $20.90 could act as intermediate halts ahead of highlighting the $20.00 psychological magnet for the XAG/USD sellers.
Trend: Further downside expected
Technical Levels: Supports and Resistances
XAGUSD currently trading at 22.31 at the time of writing. Pair opened at 22.16 and is trading with a change of 0.68% % .
| Overview | Overview.1 | |
|---|---|---|
| 0 | Today last price | 22.31 |
| 1 | Today Daily Change | 0.15 |
| 2 | Today Daily Change % | 0.68% |
| 3 | Today daily open | 22.16 |
The pair is trading below its 20 Daily moving average @ 23.55, below its 50 Daily moving average @ 23.47 , above its 100 Daily moving average @ 21.75 and above its 200 Daily moving average @ 21.01
| Trends | Trends.1 | |
|---|---|---|
| 0 | Daily SMA20 | 23.55 |
| 1 | Daily SMA50 | 23.47 |
| 2 | Daily SMA100 | 21.75 |
| 3 | Daily SMA200 | 21.01 |
The previous day high was 22.46 while the previous day low was 22.05. The daily 38.2% Fib levels comes at 22.21, expected to provide support. Similarly, the daily 61.8% fib level is at 22.3, expected to provide support.
Note the levels of interest below:
- Pivot support is noted at 21.99, 21.81, 21.57
- Pivot resistance is noted at 22.4, 22.64, 22.82
| Levels | Levels.1 |
|---|---|
| Previous Daily High | 22.46 |
| Previous Daily Low | 22.05 |
| Previous Weekly High | 24.64 |
| Previous Weekly Low | 22.29 |
| Previous Monthly High | 24.55 |
| Previous Monthly Low | 22.76 |
| Daily Fibonacci 38.2% | 22.21 |
| Daily Fibonacci 61.8% | 22.30 |
| Daily Pivot Point S1 | 21.99 |
| Daily Pivot Point S2 | 21.81 |
| Daily Pivot Point S3 | 21.57 |
| Daily Pivot Point R1 | 22.40 |
| Daily Pivot Point R2 | 22.64 |
| Daily Pivot Point R3 | 22.82 |
[/s2If]
Join Our Telegram Group
")


