#EURJPY @ 140.682 A downside break of the Inverted Flag pattern will drag firmly. (Pivot Orderbook analysis)
…
This is a premium post.
[s2If !current_user_can(access_s2member_level4)]Please register for PREMIUM VERSION HERE to read full post below containing analysis. In case of any error or you think you are not able to read the full post below, please email us at support#nehcap.com [lwa][/s2If] [s2If current_user_can(access_s2member_level4)]
- A downside break of the Inverted Flag pattern will drag EUR/JPY firmly.
- The 50-and 200-EMAs have delivered a death cross, which adds to the downside filters.
- High volatility is expected from the cross as investors await German inflation data.
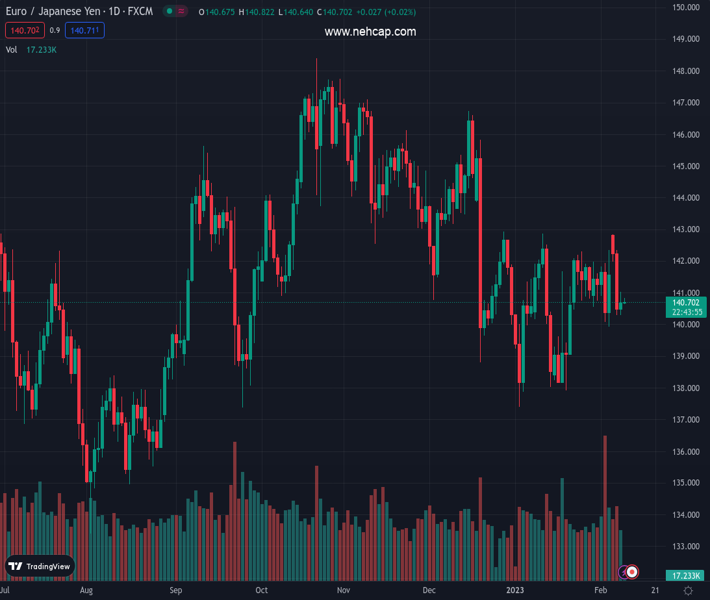
The pair currently trades last at 140.682.
The previous day high was 142.44 while the previous day low was 140.29. The daily 38.2% Fib levels comes at 141.11, expected to provide resistance. Similarly, the daily 61.8% fib level is at 141.62, expected to provide resistance.
The EUR/JPY pair dropped after facing barricades around 141.00 in the early Asian session. The pullback move in the cross seems to lack strength, which could result in a resumption in the downside move. EUR/JPY is following the footprints of weaker EUR/USD, amid the risk aversion theme.
For further guidance, investors will keep an eye on the preliminary German inflation data. The annual Harmonized Index of Consumer Prices (HICP) (Jan) is expected to strengthen further to 10.0% from the prior release of 9.6%. The double-digit inflation figure might add to troubles for the European Central Bank (ECB), which has already pushed interest rates to 2.50%, and more interest rate hikes are in pipeline, according to the commentary from ECB policymaker Klass Knot.
EUR/JPY is auctioning an Inverted Flag chart pattern on an hourly chart, which indicates a sheer consolidation that is followed by a breakdown. Usually, the consolidation phase of the chart pattern serves as an inventory adjustment in which those participants initiate shorts, which prefer to enter an auction after the establishment of a bearish bias.
A death cross, represented by the 50-and 200-period Exponential Moving Averages (EMAs) at 141.32, adds to the downside filters.
The Relative Strength Index (RSI) (14) has entered into the 40.00-60.0 range from the bearish range of 20.00-40.00. However, the strength is missing in the recovery move, which could delight sellers with a pullback selling opportunity.
Should the cross breaks below February 7 low around 140.30, Japanese Yen bulls will drag the asset toward January 17 high at 139.62 followed by the horizontal support plotted from January 13 low around 138.00.
Alternatively, the cross needs to surpass January 25 high at 142.29 for an upside move, which will drive the asset toward January 11 high at 142.61 followed by October 24 low at 143.72.
Technical Levels: Supports and Resistances
EURJPY currently trading at 140.73 at the time of writing. Pair opened at 140.6 and is trading with a change of 0.09 % .
| Overview | Overview.1 | |
|---|---|---|
| 0 | Today last price | 140.73 |
| 1 | Today Daily Change | 0.13 |
| 2 | Today Daily Change % | 0.09 |
| 3 | Today daily open | 140.60 |
The pair remains strongly bearish on the daily time frame. It trades below the 20 SMA @ 140.76, 50 SMA 141.68, 100 SMA @ 142.94 and 200 SMA @ 141.02.
| Trends | Trends.1 | |
|---|---|---|
| 0 | Daily SMA20 | 140.76 |
| 1 | Daily SMA50 | 141.68 |
| 2 | Daily SMA100 | 142.94 |
| 3 | Daily SMA200 | 141.02 |
The previous day high was 142.44 while the previous day low was 140.29. The daily 38.2% Fib levels comes at 141.11, expected to provide resistance. Similarly, the daily 61.8% fib level is at 141.62, expected to provide resistance.
Note the levels of interest below:
- Pivot support is noted at 139.78, 138.96, 137.62
- Pivot resistance is noted at 141.93, 143.26, 144.08
| Levels | Levels.1 |
|---|---|
| Previous Daily High | 142.44 |
| Previous Daily Low | 140.29 |
| Previous Weekly High | 142.34 |
| Previous Weekly Low | 139.93 |
| Previous Monthly High | 142.86 |
| Previous Monthly Low | 137.39 |
| Daily Fibonacci 38.2% | 141.11 |
| Daily Fibonacci 61.8% | 141.62 |
| Daily Pivot Point S1 | 139.78 |
| Daily Pivot Point S2 | 138.96 |
| Daily Pivot Point S3 | 137.62 |
| Daily Pivot Point R1 | 141.93 |
| Daily Pivot Point R2 | 143.26 |
| Daily Pivot Point R3 | 144.08 |
[/s2If]
Join Our Telegram Group
")


