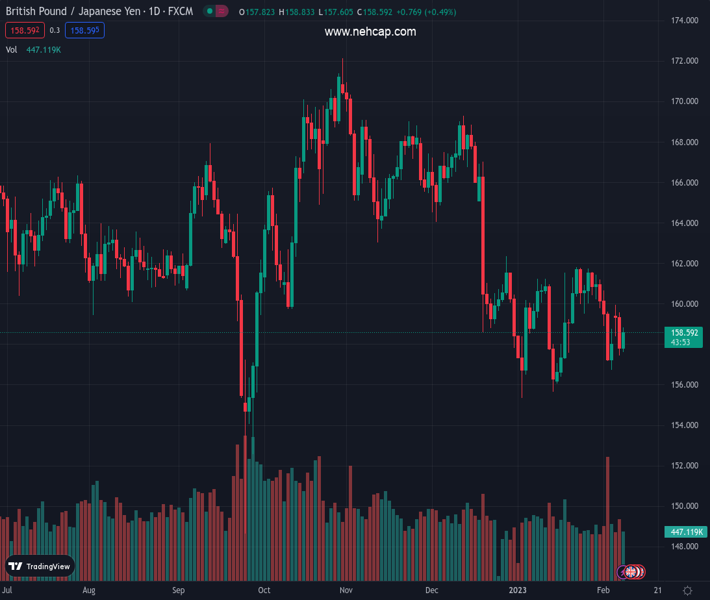
#GBPJPY @ 158.575 rebounds at weekly lows and is forming a bullish harami, suggesting that prices could aim higher. (Pivot Orderbook analysis)
…
This is a premium post.
[s2If !current_user_can(access_s2member_level4)]Please register for PREMIUM VERSION HERE to read full post below containing analysis. In case of any error or you think you are not able to read the full post below, please email us at support#nehcap.com [lwa][/s2If] [s2If current_user_can(access_s2member_level4)]
- GBP/JPY rebounds at weekly lows and is forming a bullish harami, suggesting that prices could aim higher.
- Immediate resistance levels for the GBP/JPY lie at 159.00, ahead of the 20-DMA and 160.00.
- For a bearish continuation, the GBP/JPY needs to clear 157.42, aiming to reach 157.00.
The pair currently trades last at 158.575.
The previous day high was 159.59 while the previous day low was 157.43. The daily 38.2% Fib levels comes at 158.26, expected to provide support. Similarly, the daily 61.8% fib level is at 158.76, expected to provide resistance.
The Pound Sterling (GBP) trims some of Tuesday’s losses, and climbs toward the 158.50 area on Wednesday, boosted by an upbeat sentiment across the financial markets. A speech by the Federal Reserve Chair Jerome Powell spurred a risk-on impulse and weakened safe-haven peers. At the time of writing, the GBP/JPY exchanges hands at 158.53.
The GBP/JPY bounced from weekly lows reached on Tuesday at around 157.42, with the cross-currency pair testing a one-month-old downslope previous resistance trendline, which turned support and capped the GBP/JPY’s fall. However, as shown by the daily chart, GBP/JPY’s price action would remain sideways, though tilted downwards, as long as the long-term moving averages stay above the exchange rate.
For the GBP/JPY pair to continue its bearish path, it would need to break below the weekly low of 157.42, which, once cleared, would send the GBP/JPY sliding toward the February 3 low of 156.72. A breach of the latter and the 156.00 figure is up for grabs.
As an alternate scenario, the GBP/JPY key resistance areas lie at the 20-day Exponential Moving Average (EMA) at 159.42, followed by the 160.00 psychological level. Break above and the GBP/JPY could rally and test the 50-day EMA at 160.96.
Technical Levels: Supports and Resistances
GBPJPY currently trading at 158.62 at the time of writing. Pair opened at 157.83 and is trading with a change of 0.5 % .
| Overview | Overview.1 | |
|---|---|---|
| 0 | Today last price | 158.62 |
| 1 | Today Daily Change | 0.79 |
| 2 | Today Daily Change % | 0.50 |
| 3 | Today daily open | 157.83 |
The pair remains strongly bearish on the daily time frame. It trades below the 20 SMA @ 159.38, 50 SMA 161.59, 100 SMA @ 163.45 and 200 SMA @ 163.27.
| Trends | Trends.1 | |
|---|---|---|
| 0 | Daily SMA20 | 159.38 |
| 1 | Daily SMA50 | 161.59 |
| 2 | Daily SMA100 | 163.45 |
| 3 | Daily SMA200 | 163.27 |
The previous day high was 159.59 while the previous day low was 157.43. The daily 38.2% Fib levels comes at 158.26, expected to provide support. Similarly, the daily 61.8% fib level is at 158.76, expected to provide resistance.
Note the levels of interest below:
- Pivot support is noted at 156.98, 156.12, 154.82
- Pivot resistance is noted at 159.13, 160.44, 161.29
| Levels | Levels.1 |
|---|---|
| Previous Daily High | 159.59 |
| Previous Daily Low | 157.43 |
| Previous Weekly High | 161.43 |
| Previous Weekly Low | 156.73 |
| Previous Monthly High | 161.85 |
| Previous Monthly Low | 155.36 |
| Daily Fibonacci 38.2% | 158.26 |
| Daily Fibonacci 61.8% | 158.76 |
| Daily Pivot Point S1 | 156.98 |
| Daily Pivot Point S2 | 156.12 |
| Daily Pivot Point S3 | 154.82 |
| Daily Pivot Point R1 | 159.13 |
| Daily Pivot Point R2 | 160.44 |
| Daily Pivot Point R3 | 161.29 |
[/s2If]
Join Our Telegram Group
")


