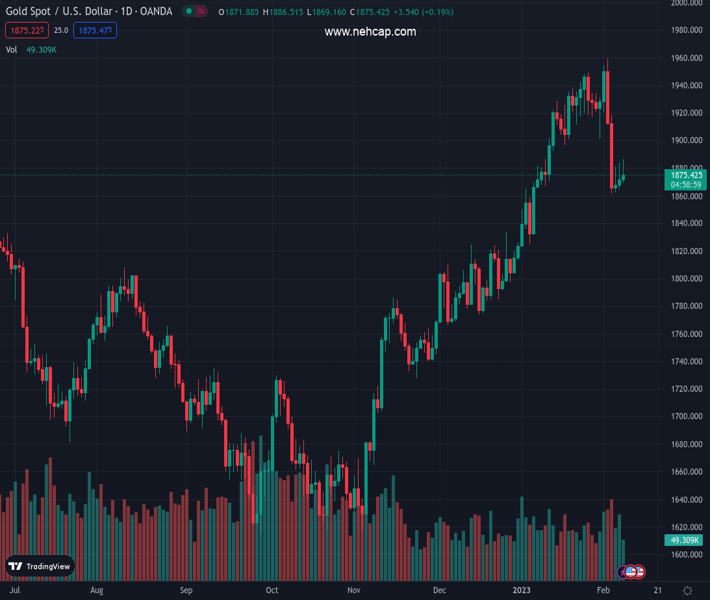
#XAUUSD @ 1,875.40 Gold price is printing minimal gains of 0.14%, bolstered by lower US real yields. (Pivot Orderbook analysis)
…
This is a premium post.
[s2If !current_user_can(access_s2member_level4)]Please register for PREMIUM VERSION HERE to read full post below containing analysis. In case of any error or you think you are not able to read the full post below, please email us at support#nehcap.com [lwa][/s2If] [s2If current_user_can(access_s2member_level4)]
- Gold price is printing minimal gains of 0.14%, bolstered by lower US real yields.
- Federal Reserve officials remain committed to tackling high inflation in the US, as said by Fed’s Williams and Cook.
- Gold Price Forecast: Sideways, after diving from the YTD high to the 50-DMA.
The pair currently trades last at 1875.40.
The previous day high was 1884.49 while the previous day low was 1865.05. The daily 38.2% Fib levels comes at 1877.06, expected to provide resistance. Similarly, the daily 61.8% fib level is at 1872.48, expected to provide support.
Gold price is almost flat during the North American session, meandering around the $1870 area after hitting a daily high of $1886.35, though it failed to gain traction as the US Dollar (USD) pares some of its earlier losses. At the time of writing, XAU/USD is trading at around $1875, above its opening price.
US equity futures continued to trade negatively amidst a slew of Federal Reserve (Fed) officials emphasizing the need to raise rates to curb elevated inflation. Policymakers led by the New York Fed President John Williams said there’s “uncertainty” around inflation. He added that a jump in inflation could trigger a reaction by the US central bank.
Later, Fed Governor Lisa Cook said that even though the Fed sees improvement in inflation, it’s still running too high. She added that the US central bank is focusing on restoring price stability and reiterated the Fed is not done raising interest rates.
Market participants reacted, sending US Treasury bond yields higher, with the 10-year benchmark note rate at 3.679%. Consequently, the greenback, as shown by the US Dollar Index, registers minuscule gains of 0.09%, at 103.42.
Despite US Treasury yields being up and the buck too, the yellow metal clings to gains, underpinned by falling US Real Yields. The US 10-year TIPS, a proxy for Real Yields, stumbles from 1.351% to 1.326%, a tailwind for precious metals. The XAU/USD meanders around $1874, within the boundaries of the 20 and 50-day Exponential Moving Averages (EMAs), each at $1895.18 and $1856.20, respectively.
Gold’s daily timeframe suggests the yellow metal remains upward biased, though on an ongoing pullback. XAU/USD’s dip from the YTD high of S1959.74 towards Monday’s low of S1860.44 was capped by the 50-day EMA presence. Nevertheless, uncertainty clouds the outlook, as observed by XAU/USD’s price action, registering three successive candles with small bodies but longer upper wicks. That suggests that selling pressure remains.
Downwards, the XAU/USD first support would be $1869.16, followed by $1865.08 and $1860.44. Upwards, Gold’s first resistance would be $1886.35, followed by the 20-day EMA at $1895.30, ahead of the $1900 figure.
Technical Levels: Supports and Resistances
XAUUSD currently trading at 1875.13 at the time of writing. Pair opened at 1870.23 and is trading with a change of 0.26 % .
| Overview | Overview.1 | |
|---|---|---|
| 0 | Today last price | 1875.13 |
| 1 | Today Daily Change | 4.90 |
| 2 | Today Daily Change % | 0.26 |
| 3 | Today daily open | 1870.23 |
The pair is trading below its 20 Daily moving average @ 1913.83, above its 50 Daily moving average @ 1851.04 , above its 100 Daily moving average @ 1770.45 and above its 200 Daily moving average @ 1776.02
| Trends | Trends.1 | |
|---|---|---|
| 0 | Daily SMA20 | 1913.83 |
| 1 | Daily SMA50 | 1851.04 |
| 2 | Daily SMA100 | 1770.45 |
| 3 | Daily SMA200 | 1776.02 |
The previous day high was 1884.49 while the previous day low was 1865.05. The daily 38.2% Fib levels comes at 1877.06, expected to provide resistance. Similarly, the daily 61.8% fib level is at 1872.48, expected to provide support.
Note the levels of interest below:
- Pivot support is noted at 1862.02, 1853.82, 1842.58
- Pivot resistance is noted at 1881.46, 1892.7, 1900.9
| Levels | Levels.1 |
|---|---|
| Previous Daily High | 1884.49 |
| Previous Daily Low | 1865.05 |
| Previous Weekly High | 1959.80 |
| Previous Weekly Low | 1861.45 |
| Previous Monthly High | 1949.27 |
| Previous Monthly Low | 1823.76 |
| Daily Fibonacci 38.2% | 1877.06 |
| Daily Fibonacci 61.8% | 1872.48 |
| Daily Pivot Point S1 | 1862.02 |
| Daily Pivot Point S2 | 1853.82 |
| Daily Pivot Point S3 | 1842.58 |
| Daily Pivot Point R1 | 1881.46 |
| Daily Pivot Point R2 | 1892.70 |
| Daily Pivot Point R3 | 1900.90 |
[/s2If]
Join Our Telegram Group
")


