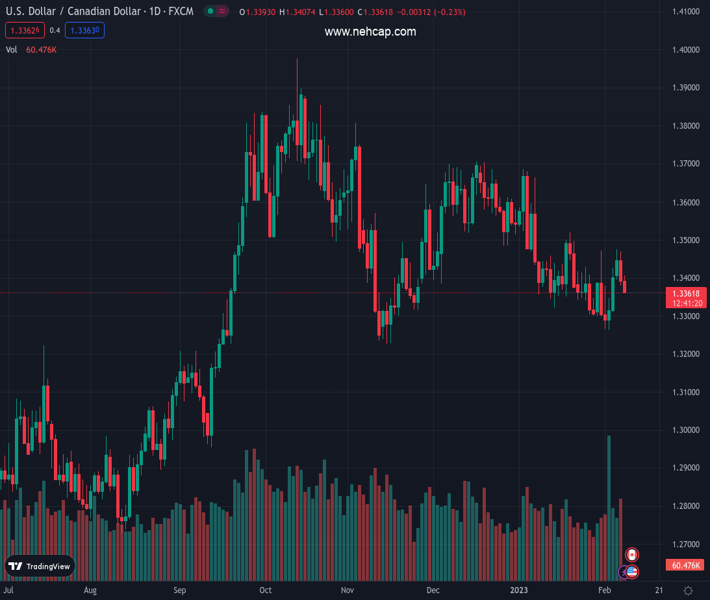
#USDCAD @ 1.33620 drifts lower for the second straight day and is pressured by a combination of factors. (Pivot Orderbook analysis)
…
This is a premium post.
[s2If !current_user_can(access_s2member_level4)]Please register for PREMIUM VERSION HERE to read full post below containing analysis. In case of any error or you think you are not able to read the full post below, please email us at support#nehcap.com [lwa][/s2If] [s2If current_user_can(access_s2member_level4)]
- USD/CAD drifts lower for the second straight day and is pressured by a combination of factors.
- The ongoing rally in oil prices underpins the Loonie and weighs on the pair amid a weaker USD.
- A sustained break below the 1.3400 mark might have already set the stage for additional losses.
The pair currently trades last at 1.33620.
The previous day high was 1.3469 while the previous day low was 1.338. The daily 38.2% Fib levels comes at 1.3414, expected to provide resistance. Similarly, the daily 61.8% fib level is at 1.3435, expected to provide resistance.
The USD/CAD pair extends this week’s retracement slide from the 1.3470-1.3475 region and remains under heavy selling pressure for the second successive day on Wednesday. The downward trajectory picks up pace during the first half of the European session and drags spot prices to
fresh weekly low, around the 1.3365 region in the last hour.
Crude oil prices add to the previous day’s strong gains and scale higher for the third successive day amid concerns about supply disruptions caused by a major earthquake in Turkey. This, in turn, is seen underpinning the commodity-linked Loonie, which, along with the emergence of fresh selling around the US Dollar, exerts downward pressure on the USD/CAD pair.
Fed Chair Jerome Powell failed to offer fresh hawkish signals on Tuesday and reiterated that the process of disinflation was underway. The comments dampen market expectations that the Fed will stick to its hawkish stance and raises hopes that interest rates may not rise much further. This, in turn, drags the US Treasury bond yields lower and weighs on the USD.
The prevalent cautious mood, however, could lend some support to the safe-haven greenback. The market sentiment remains fragile amid worries about economic headwinds stemming from rapidly rising borrowing costs, the COVID-19 outbreak in China and the protracted Russia-Ukraine war. Furthermore, looming recession risks might keep a lid on any further gains for the black liquid.
The aforementioned factors might contribute to limiting the downside for the USD/CAD pair, at least for the time being. That said, the overnight break below the 1.3400 round-figure mark suggests that the USD/CAD pair’s recent strong recovery move from the lowest level since November 16 has run its course and supports prospects for a further intraday depreciating move.
In the absence of any relevant market-moving economic data from the US, traders will take cues from scheduled speeches by influential FOMC members. This, along with the US bond yields and the broader risk sentiment, will drive the USD. Apart from this, oil price dynamics should provide some impetus and allow traders to grab short-term opportunities around the USD/CAD pair.
Technical Levels: Supports and Resistances
USDCAD currently trading at 1.3367 at the time of writing. Pair opened at 1.3404 and is trading with a change of -0.28 % .
| Overview | Overview.1 | |
|---|---|---|
| 0 | Today last price | 1.3367 |
| 1 | Today Daily Change | -0.0037 |
| 2 | Today Daily Change % | -0.2800 |
| 3 | Today daily open | 1.3404 |
The pair is trading below its 20 Daily moving average @ 1.3382, below its 50 Daily moving average @ 1.3494 , below its 100 Daily moving average @ 1.3536 and above its 200 Daily moving average @ 1.3227
| Trends | Trends.1 | |
|---|---|---|
| 0 | Daily SMA20 | 1.3382 |
| 1 | Daily SMA50 | 1.3494 |
| 2 | Daily SMA100 | 1.3536 |
| 3 | Daily SMA200 | 1.3227 |
The previous day high was 1.3469 while the previous day low was 1.338. The daily 38.2% Fib levels comes at 1.3414, expected to provide resistance. Similarly, the daily 61.8% fib level is at 1.3435, expected to provide resistance.
Note the levels of interest below:
- Pivot support is noted at 1.3366, 1.3328, 1.3277
- Pivot resistance is noted at 1.3455, 1.3507, 1.3544
| Levels | Levels.1 |
|---|---|
| Previous Daily High | 1.3469 |
| Previous Daily Low | 1.3380 |
| Previous Weekly High | 1.3472 |
| Previous Weekly Low | 1.3262 |
| Previous Monthly High | 1.3685 |
| Previous Monthly Low | 1.3300 |
| Daily Fibonacci 38.2% | 1.3414 |
| Daily Fibonacci 61.8% | 1.3435 |
| Daily Pivot Point S1 | 1.3366 |
| Daily Pivot Point S2 | 1.3328 |
| Daily Pivot Point S3 | 1.3277 |
| Daily Pivot Point R1 | 1.3455 |
| Daily Pivot Point R2 | 1.3507 |
| Daily Pivot Point R3 | 1.3544 |
[/s2If]
Join Our Telegram Group
")


